


Apr – Jun 2023
Investment Market Review
Global share markets advanced again during the quarter, with the gains being led by developed markets and, most notably, large US technology companies.
With moderating US inflation and signs that the American economy had displayed resilience in spite of higher interest rates, global investor sentiment remained generally positive.
There was some caution surrounding the US debt ceiling negotiations reported at the beginning of the quarter, however, in early June, Congress approved legislation that suspended the debt ceiling in a deal that was expected to have very little impact on economic growth.
The Chinese share market bucked the generally positive trend as the economic rebound following their post-Covid reopening, quickly began to cool.
After declining over the first quarter, global interest rates were generally on the rise again with most major central banks continuing to raise rates over the quarter. However, in a positive move signifying that inflation (at least in the US) may now be in retreat, the US Federal Reserve was the first central bank to pause their rate hiking program in June.
AI – the rise of the machines
The first six on this list are technology companies which have benefited from the growing hype and excitement surrounding artificial intelligence (AI) – specifically natural language processing tools such as ChatGPT.
Despite stubborn inflation and rising interest rates that typically hamper the performance of growth focused technology companies, the prices of AI-linked businesses that might benefit from the future implementation of this technology have been driven significantly higher. The question for this technology is – where to from here?
Wall Street and the news media in general have been quick to promote the hype around AI technology, with some labelling it the start of a fourth industrial revolution that will help transform life on earth. Others say the sudden enthusiasm for AI has the same hallmarks as the meteoric rise of cryptocurrencies and meme stocks during the Covid pandemic, or the mania surrounding the internet companies of the dotcom era during the early 2000s.
 The challenge for investors is that even if AI is to become a utility in our daily lives, it doesn’t mean every AI company is automatically worth buying, especially at their current (much higher) valuations.
In that regard, the dotcom bubble may hold valuable lessons. Hype about the internet drove up the technology-heavy Nasdaq Composite index by 400% between 1995 and 2000. When the dotcom bubble finally burst, the Nasdaq subsequently fell nearly 77% between March 2000 and October 2002, with many of the once high-flying internet companies falling all the way to zero.
The challenge for investors is that even if AI is to become a utility in our daily lives, it doesn’t mean every AI company is automatically worth buying, especially at their current (much higher) valuations.
In that regard, the dotcom bubble may hold valuable lessons. Hype about the internet drove up the technology-heavy Nasdaq Composite index by 400% between 1995 and 2000. When the dotcom bubble finally burst, the Nasdaq subsequently fell nearly 77% between March 2000 and October 2002, with many of the once high-flying internet companies falling all the way to zero.Looking back, excitement about the long-term benefits of the internet was well founded, but that didn’t stop some investors eventually losing a lot of money chasing the hype.
Recessions – do they matter?
In New Zealand, the economy is currently wrestling with rising interest rates, a cost of living crisis and a general shortage of skilled workers. We are also, based on recent growth data, in a technical recession. What’s not quite so clear, is whether we should be concerned about it.
A recession is defined as two consecutive quarters of contraction in economic activity, or in simple terms, it’s what happens when the economy shrinks. Economic output (measured by changes in gross domestic product (GDP)) tends to shrink during a recession because there’s generally higher unemployment, less consumer demand and reduced production of goods and services. Housing prices are also prone to weakening during recessions.
Although New Zealand’s economic output has declined (partly due to the destructive effects of cyclone Gabrielle) and our housing market is currently weaker, unemployment has been surprisingly slow to rise and consumer spending continues to hold up remarkably well.
It’s that combination of factors (some weaker, but some still strong) that currently make this recession a little less concerning. Yes, it’s a small mathematical decline, but it’s not a meaningful contraction across a broader range of categories where employment, consumer spending, retail sales and production are all struggling. That would be more concerning.
In general, recessions can last anywhere from a few months to a several years, but over the past several decades most recessions in New Zealand have been less than a year. On that basis, we may already be closer to the end of this recession than the beginning. Unless conditions were to suddenly take a significant turn for the worse, the fact that we may be in a technical recession today shouldn’t, on its own, be terribly concerning.
Investing during a recession
Although economic activity shrinks during a recession it doesn’t mean investment returns will also shrink. While recessions can certainly lead to weaker markets, when we look at the average performance of share markets during recessions the findings are interesting.
For example, the main share market index in the US (the S&P 500) has actually increased by an average of around 1% during all recession periods since 1945. In part, that’s because share markets usually peak before the start of a recession and bottom out before their conclusion. In other words, the worst is generally over for shares before it’s over for the rest of the economy.
It’s also why share markets are widely acknowledged as being forward-looking. When a share market is declining it can (amongst other things) be a sign that investors might believe the economy could be headed towards recession.
If an economy eventually moves into recession, share prices are typically already lower by that time. However, when share prices are lower the expected future return from owning shares generally increases, making share ownership more attractive! And, given the average short duration of most recessions, it’s not unreasonable for the confirmation of a recession to be viewed as a long term buy signal.
To reinforce the point that a recession doesn’t guarantee a poor investment outcome, we only have to look at the performance of our own share market over the period from September 2022 to end March 2023, when the New Zealand economy is now acknowledged to have been in a technical recession. The local S&P/NZX 50 Index (gross with imputation) went up 3.79% between September and December 2022, followed by a further increase of 3.89% between January and March 2023.
These returns are welcome in any economic environment.
Interest rates – what next?
We need to continue taking our cues from the Reserve Bank, because they are responsible for setting the level of short-term interest rates in New Zealand. These short-term rates are set when they adjust the official cash rate (OCR). Longer term interest rates, including mortgage rates, are determined by market forces, but all are related in some way to the prevailing level of the OCR.
In November 2022, the Reserve Bank projected a peak in the OCR of 5.50% and, after another 0.25% increase at their May 2023 meeting, that is where the OCR now sits – at exactly 5.50%. The wider market is not yet convinced this will be the end of New Zealand’s rate rising
cycle, but through the quarter the market consensus was that the Reserve Bank will pause at this level, at least for a while. By pausing here, it will allow time for the lagged effects of the previous rate rises to continue to gradually slow the economy down and bring inflation back towards their long-term target band of 1-3%.
Having moved the OCR up quickly since October 2021, and with New Zealand already in a technical recession, the Reserve Bank will tread very lightly now. While they are intent on dampening inflation, they don’t want to risk turning a mild recession into a deeper and more prolonged downturn. They also know that with over 50% of outstanding mortgages due to be refixed at higher interest rates over the coming year, this will act as a further handbrake on discretionary consumer spending over the coming months.
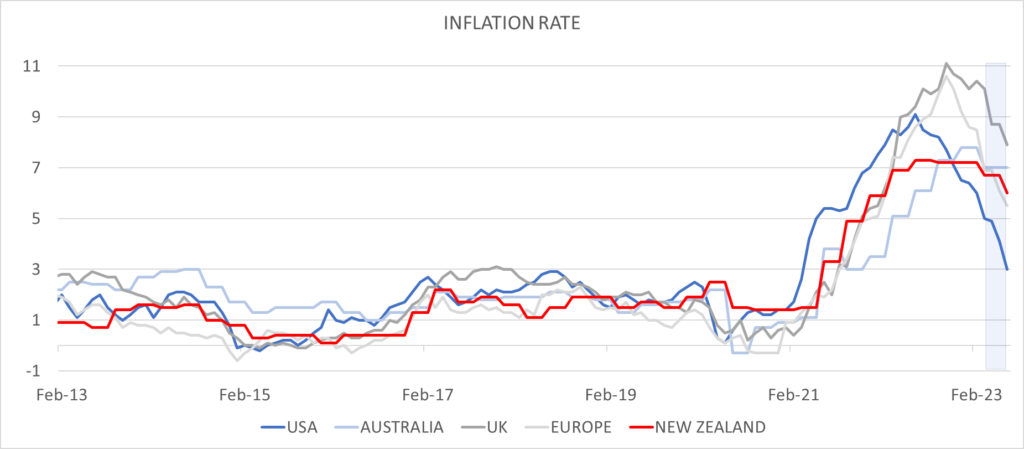
On the positive side, there is enough early evidence to suggest that monetary policy is beginning to work. Economic growth is already contracting. Inflation, on a quarterly basis, is slowly dropping and taking inflation expectations with it. And the labour market has moved from being extremely tight to now showing a very slight increase in the unemployment rate.
The market is currently pricing short-term interest rates to begin falling again in New Zealand in 2024.
Stay focused on what works
Following the significant Covid interruptions of early 2020, central banks around the world are still trying to navigate the best route to take for their economies to achieve greater stability and prosperity.
It hasn’t been straight-forward. The economic reboot from a near global shutdown has thrown up a myriad of unexpected challenges – supply chain issues, production shortages, cost pressures, labour shortages, galloping inflation and, recently, rapidly rising global interest rates.
However, one by one, these challenges are being met.
That economic growth has come under pressure in the meantime is entirely understandable. That policy makers will eventually win this battle, is equally inevitable.
As individual investors, we simply need to keep our focus on the things we can control – following our strategic plan, staying diversified and maintaining discipline.
Challenges, fads, speculation and uncertainty will always be a part of why markets will deliver positive long-term returns. It’s the reward paid to investors for taking investment risk.
And the best way to manage those risks is to acknowledge their existence, develop strategies to manage or mitigate them, and then implement them.
Key Market movements For the Quarter
Central banks maintained their laser-like focus on combatting inflation by continuing to raise interest rates globally during the quarter.
With the Eurozone and New Zealand economies already in a mild recession and other regions facing a lower growth outlook, at least in the near term, share markets were not burdened by high expectations.
However, with plenty of bad news having already been factored into share prices last year, it was pleasing to see international developed share markets still perform strongly over the quarter. Leading the way were a number of mega-cap US technology firms identified as potential beneficiaries of any greater movement towards increased utilisation of artificial intelligence.
Although share market returns across Australasia and the emerging markets were less significant, these regions also contributed positively to investor returns during the quarter.
With global interest rates moving higher again, in particular in the UK and Australia where inflation pressures were proving a little harder to dampen, the overall returns from global bonds were fairly flat.
When the US Federal Reserve announced they were pausing their interest rate hiking programme in June, it provided a tangible and important sign, to end the quarter, that the global fight against inflation was making positive progress.
+0.4%
The New Zealand share market, as measured by the S&P/NZX 50 Index, eked out a small positive return in the second quarter of 2023.
Of the top 50 companies, four in particular stood out. Software company Serko Ltd reaffirmed its strong growth projections for next year and soared +56.9% over the quarter. Retirement village operators Arvida Group and Ryman Healthcare gained +38.0% and +25.3% respectively, with Arvida announcing a record profit this year and Ryman projecting a lift in net profits of 20-30% next year. Fletcher Building rounded out the notable performers, advancing +24.3% on the back of improved overall news flow.
It wasn’t such a memorable quarter for all New Zealand companies, however. Pharmaceutical supplier Ebos Group saw its share price slump -21.0% following news that the Chemist Warehouse would not be renewing a $1.9 billion supply contract when it expires next June. While a2 Milk shares drifted -14.3% following further weakness in Chinese infant formula demand.
Source: S&P/NZX 50 Index (gross with imputation credits)
+0.4%
New Zealand Fixed Interest
Consistent with overseas trends, on 24 May the Reserve Bank of New Zealand (RBNZ) raised the Official Cash Rate (OCR) by a further 0.25% to a level of 5.50%.
In the accompanying monetary policy statement, the RBNZ noted that “inflation is expected to continue to decline from its peak and with it measures of inflation expectations. However, core inflation pressures will remain until capacity constraints ease further. While employment is above its maximum sustainable level, there are now signs of labour shortages easing and vacancies declining.”
New Zealand government bond yields rose during the quarter, with the New Zealand 10 year bond yield increasing from 4.23% to 4.65% by 30 June. With better-than-expected economic and company news helping ease investor concerns, New Zealand corporate bonds outperformed government bonds over the period.
The S&P/NZX A-Grade Corporate Bond Index rose +0.4% for the quarter, while the longer duration but higher quality S&P/NZX NZ Government Bond Index fell -1.6%.
Source: S&P/NZX A-Grade Corporate Bond Index
+3.1%
New Zealand Property
The NZ REIT sector was up 3.1% in the quarter and 5% during 2023. This has been a welcome bounce after a poor performance in 2022.
The reporting season didn’t throw up any surprises with a benign outlook on activity and dividends. Increased funding costs are increasing the challenge facing the sector.
In the quarter, Stride Property rebounded returning +8.5% and Goodman Property also returned 4.5%. The poorest performing REITs were Vital Healthcare at 1.4% and Kiwi Property at 1.9%.
Source: S&P/NZX All Real Estate Index.
+2.6%
Australian Shares
The Australian share market (S&P/ASX 200 Total Return Index) registered a small gain in the second quarter, advancing +1.0% in Australian dollar terms.
Although numerous micro-cap basic materials firms and technology companies posted stellar gains during the quarter, these had a negligible impact on the performance of the market which is much more heavily influenced by the results of the big banking companies and the mega-cap basic materials firms, BHP and Rio Tinto.
With BHP and Rio Tinto down -4.7% and -4.5% respectively, on the back of ongoing weakness in iron ore and industrial metals prices, this was a major factor in the subdued performance of the index.
The major banks performed a little better on average, as two further increases in the Australian cash rate during the quarter were seen as a positive for bank lending margins and profitability. ANZ Group led the banking cohort gaining +6.9%, with the Commonwealth Bank (+2.0%) and Westpac (+1.8%), also recording gains.
While the local Australian index only recorded a small gain, the slightly weaker New Zealand dollar meant that reported returns to unhedged New Zealand investors improved to +2.6% over the quarter.
Source: S&P/ASX 200 Index (total return)
+2.9%
Emerging Markets
Emerging markets posted a small positive return over the second quarter, rising +1.0% in US dollar terms.
The Chinese share market was a major contributor to the lower returns. The anticipated economic rebound following China’s reopening after the Covid-19 crisis began to falter, driving Chinese shares sharply lower.
Hungary, Poland and Greece were the top performing emerging markets in USD terms despite rising recessionary fears in Europe. Brazil was also a top performer as growing optimism about potential interest rate cuts and better than expected first quarter growth figures, led to strong gains in Brazil’s Bovespa Index.
Indian shares also performed well, driven by foreign inflows and steady earnings, as encouraging economic data boosted sentiment towards the country.
In spite of China’s weakness, the emerging markets group contributed positively, and the slightly weaker New Zealand dollar over the quarter meant the MSCI Emerging Markets Index produced a quarterly return of +2.9% in unhedged New Zealand dollar terms.
Source: MSCI Emerging Markets Index (gross div.)
+7.5% (hedged to NZD)
+9.0% (unhedged)
International Shares
US and Eurozone share markets made good gains in the second quarter, with the bulk of these gains coming in June.
Information technology companies benefitted from investor excitement about the future applications for artificial intelligence and a number of technology and semi-conductor companies saw their prices appreciate strongly.
Although both regions raised interest rates during the quarter, the greater resilience of the US economy encouraged the Federal Reserve to pause their hiking programme in June – an encouraging sign for equity markets.
The UK share market was weaker over the quarter. Higher than expected core inflation data resulting from strong job and wage growth figures suggested the Bank of England still had work to do to get on top of inflation on a sustainable basis. This led to a reacceleration in interest rate hikes for the UK which presented a clear headwind for the domestic UK share market.
Against major currencies, the New Zealand dollar was a little weaker through the quarter which meant increased reported returns for investors holding unhedged foreign assets.
The MSCI World ex-Australia Index delivered a healthy return of +7.5% for the quarter hedged to the NZ dollar, and +9.0% for the unhedged index.
Source: MSCI World ex-Australia Index (net div.)
-0.2%
International Fixed Interest
The second quarter of 2023 saw a significant drop in bond market volatility.
Government bond yields were generally on the rise again, although there was some divergence. UK and Australian bonds both underperformed their peers due to reporting higher-than-expected inflation figures and a renewed resolve by these central banks to combat inflation.
With the exception of the Bank of Japan, all major central banks kept raising interest rates over the quarter. However, the US Federal Reserve was the first to pause in June, leaving short term US interest rates at 5%-5.25% after more than a year of consecutive rate increases.
With US growth surprising to the upside, and with a ‘soft landing’ scenario now being the market consensus, US corporate bonds outperformed US government bonds.
Over the quarter, the US 10 year bond yield increased from 3.47% to 3.84%, with the two year bond yield moving from 4.04% to 4.90%, marking a further inversion of the US yield curve. Germany’s 10 year bond yield rose more sedately from 2.30% to 2.39%, while the UK 10 year yield jumped from 3.49% to 4.39% on the back of disappointing inflation figures.
The FTSE World Government Bond Index 1-5 Years (hedged to NZD) returned -0.2% for the quarter, while the broader Bloomberg Global Aggregate Bond Index (hedged to NZD) gained +0.1%.
Source: FTSE World Government Bond Index 1-5 Years (hedged to NZD)
+2.9% (global property)
-0.8% (global infrastructure)
International Property
Global REITs had a reasonable quarter, up almost 3%, and over 6% so far in 2023.
In the quarter, Australia REITs returned +1.8% and U.S REITs +2.7%.
International Infrastructure
The FTSE Developed Core Infrastructure Index returned -0.8% in AUD terms over the quarter.
The largest asset allocations within the index at the end of December were Conventional Electricity at 35.7%, Railroads at 20.2%, Pipelines at 14.0% and multi-utilities at 11.4% of the index. The largest investments in the fund are NextEra Energy at 6.7% and Union Pacific Corp at 5.6%.
Source: S&P Developed REIT Index, FTSE Developed Core Infrastructure Index in AUD
Asset Class Returns To 30 June 2023
| Asset Class | Index Name | 3 mths | 1 year | 3 years | 5 years | 10 years |
|---|---|---|---|---|---|---|
| New Zealand shares | S&P/NZX 50 Index, (gross with imputation credits) | +0.4% | +10.6% | +2.1% | +6.7% | +11.5% |
| New Zealand property | S&P /NZX All Real Estate Index (Gross) | +3.1% | -0.7% | +1.1% | +4.4% | +7.4% |
| Australian shares | S&P/ASX 200 Index (total return) | +2.6% | +12.7% | +11.7% | +7.0% | +7.7% |
| International shares | MSCI World ex Australia Index (net div., hedged to NZD) | +7.5% | +17.4% | +12.0% | +8.7% | +11.0% |
| MSCI World ex Australia Index (net div.) | +9.0% | +20.8% | +14.1% | +11.3% | +12.2% | |
| Emerging markets shares | MSCI Emerging Markets Index (gross div.) | +2.9% | +4.0% | +4.4% | +3.3% | +5.8% |
| International property | S&P Global REIT Index (Gross div.) | +2.9% | -0.2% | +8.2% | +4.5% | +7.4% |
| New Zealand fixed interest | S&P/NZX A-Grade Corporate Bond Index | +0.4% | +2.0% | -2.1% | +1.2% | +3.2% |
| International fixed interest | FTSE World Government Bond Index 1-5 years (hedged to NZD) | -0.2% | -0.1% | -1.2% | +0.8% | +2.1% |
| International fixed interest | Bloomberg Global Aggregate Bond Index (hedged to NZD) | +0.1% | -0.3% | -3.1% | +0.6% | +3.0% |
| New Zealand cash | New Zealand One-Month Bank Bill Yields Index | +1.4% | +4.5% | +1.9% | +1.7% | +2.2% |