


Diversified investors had more reasons to smile as the markets began this year exactly as they left off last year – with another strong gain by most international share markets.
In the absence of any major new economic or geopolitical shocks, investment sentiment continued to be closely linked to changes in the inflation and interest rate landscape. On that front, the first quarter of 2024 saw another discernible shift in inflation and interest rate expectations.
Initially, markets were anticipating central banks would act relatively quickly to begin lowering interest rates this year. However, these expectations were gradually scaled back. Despite indications of inflationary pressures generally easing, a stubborn inflation reading in the US tempered the US Federal Reserve’s enthusiasm for interest rate cuts.
With inflation remaining a primary concern globally, the European Central Bank, the Bank of England, and the US Federal Reserve all proceeded with greater caution during the quarter. All were very careful to avoid making premature declarations of victory over inflation. At the same time, the Bank of Japan increased interest rates for the first time in 17 years, signalling an end to their negative interest rate settings.
Meanwhile, global economic activity was on the upswing. The US economy continued to outperform expectations, buoyed by sustained consumer spending. While the eurozone’s progress was slower, there were reasons for optimism, with manufacturing showing signs of a revival.
As the quarter progressed, government bond yields adjusted in response to shifting market sentiment. Most 10-year government bond yields increased over the quarter which reduced the returns from most sovereign bond markets.
Japan on the rise
While large US information technology companies have attracted most of the media attention in recent quarters, the performance of the Japanese share market has been largely unheralded.
For decades, international investors have had a frustrating relationship with Japan’s share market, whose subdued returns have mirrored the country’s protracted economic stagnation.
However, these days, Japanese shares are viewed much more positively, with the Nikkei 225 index gaining more than 20% in the first quarter to reach a 34-year high.
After limping through Japan’s “lost decades” following the collapse of a massive asset bubble in the 1990s, Tokyo’s benchmark share market index has quadrupled in value over the last 12 years and doubled since March 2020. For Japan, the world’s third largest economy, it has been a timely reawakening.
Prime Minister Fumio Kishida’s “new capitalism” drive, has sought to encourage a shift from saving towards investing, relaunching the government’s Nippon Individual Savings Account (NISA) programme with higher annual investment limits and extended tax-exemption periods.
This has coincided with recent corporate governance reforms directed by the Tokyo Stock Exchange, that have led Japanese companies to seek to increase shareholder returns through share buybacks and higher dividend payouts.
 A weak Japanese yen, hovering at its lowest levels since the 1990s, has helped boost corporate profits and made Japanese companies, already cheap by international standards, even better value.
While analyst views are mixed about the prospects for Japanese shares from here, the improved performance of the Japanese share market in recent years has been undeniable.
Gold rush
What is going on with the price of gold? By the end of the first quarter of 2024, gold had hit a new all-time high of over USD2,200 an ounce.
From a valuation and expected returns perspective, making a case for gold as an investment asset is always challenging. The metal provides no cash flows, dividends, income or earnings of any kind. And yet, for thousands of years, gold has had a reputation of being valuable.
It is commonly seen as a store of value (often popular in a market crisis), and a potentially useful diversifier because it won’t necessarily move up or down in synch with other investment assets.
However, to get a better understanding of how gold has performed as an investment, it’s helpful to look at longer-term returns.
From 1928 to 2023 the compound annual returns for various assets have been as follows(1):
US Shares: +9.8% p.a.
US Gov. Bonds +4.6% p.a.
Cash +3.3% p.a.
Gold +4.9% p.a.
So, gold has performed better than bonds and cash but has trailed the share market by a significant margin. But even this long term data requires some further context.
The price of gold was essentially controlled by the US government until 1971 when President Nixon ended the gold standard of converting US dollars to gold at a fixed rate. Over the following decade from 1971 to 1980, gold delivered a ten-year annualised return of 31.8% per year.
The price of gold was essentially controlled by the US government until 1971 when President Nixon ended the gold standard of converting US dollars to gold at a fixed rate. Over the following decade from 1971 to 1980, gold delivered a ten-year annualised return of 31.8% per year.
Some might argue that meant gold was an amazing inflation hedge during that time. Others might say those massive returns were simply the gold price “catching-up” from the earlier decades in which the government artificially held the price down.
If you look at the gold price performance since 1980, it tells a very different story. From 1981-2023, gold has delivered an annualised return of just 3.0% per year, lagging the returns of US shares (+11.3%), US Government bonds (+6.7%) and Cash (+3.8%).
Even worse, since the US inflation rate over the same period has also been 3.0%, it means gold has delivered a real return over the last 43 calendar years of precisely zero. Not such a great inflation hedge after all.
Many assets will have their time in the sun and gold is certainly one of those at present. However, it is always important not to overemphasise great short term performance if there is no sound rationale for why those returns should persist over the long term.
New Zealand Incorporated
The first corporate reporting season of the year in New Zealand was mixed with more companies missing profit expectations than beating them and more post-result forecast earnings reductions than increases.
In general, these earnings downgrades reflect the difficult economic conditions facing many local businesses at present – their input costs (including labour and debt servicing) are increasing, while revenue is slowing.
With a negative GDP growth rate confirmed for the December quarter (confirming a return to a technical recession in the second half of 2023), the Reserve Bank of New Zealand (RBNZ) left domestic interest rates unchanged at its 28 February meeting.
However, its updated forecast interest rate path implied interest rate cuts starting slightly earlier than before – now in the first half of 2025. Previously it was projecting rate cuts beginning in the second half of that year.
The RBNZ is of the view that the current tight monetary policy settings are starting to work as core inflation and most inflation expectations have declined.

However, with inflation still above the bank’s target band, the RBNZs tolerance for any future inflation surprises remains very low. In other words, if inflation indicators were to start moving up again, the RBNZ have clearly signalled it is prepared to raise rates further.
In the meantime, the pathway to lower interest rates in New Zealand seems to have edged just a little closer, hopefully providing a little comfort for stretched businesses and homeowners.
The housing market
New Zealand consumers are feeling the pressure at present and some of this is linked to changes in the housing market.
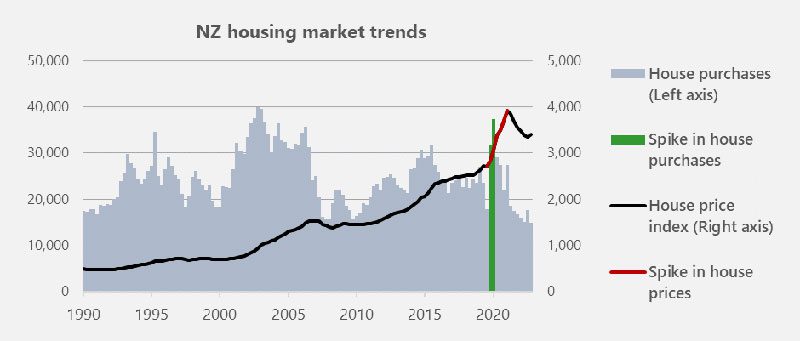
As the chart below shows(2), the New Zealand housing market experienced a notable spike in purchases over the second half of 2020 (green bars). This was back when we were emerging from the initial Covid lockdown, flush with extra savings and facing historically low interest rates. For many New Zealanders, whose DNA is steeped in property ownership, this represented an opportunity too appealing to pass up. The significant positive impact this subsequently had on house prices (orange line) is equally revealing.
More recently however, not only has the volume of house purchases progressively declined, so too has the New Zealand house price index. In fact, since its peak in December 2021, the house price index has declined -13.3%.
In just 18 months the mood of potential home buyers shifted from FOMO (fear of missing out) to FOOP (fear of over-paying), and part of that readjustment related to the swift increase in mortgage interest rates.
Most mortgage borrowers are now exposed to materially higher mortgage rates than those available only 2-3 years ago. For example, 1-year special mortgage rates have increased from a low of 2.2% in June 2021 to around 7.2% today. The average outstanding home mortgage rate has also increased from below 3% in September 2021 to almost 6% today and is likely to increase further.
While this increase in average mortgage rates has been accompanied by an increase in the number of home loans in arrears (credit reporting agency Centrix noted an increase from less than 1% of mortgages in arrears in 2022, to more than 1.5% today) it is not yet at concerning levels.
However, the trend suggests that New Zealand consumers, on average, are starting to feel the effects of the current monetary policy settings, and it is something the RBNZ will be keeping a close watch on when they make their future interest rate decisions.
Long term perspective
For younger New Zealanders looking to start their careers or secure their place on the property ladder, the immediate outlook likely feels uncertain – particularly in respect of the economic environment (business health and job opportunities), and level of interest rates (mortgage costs).
For New Zealanders more established in their careers or even in retirement, this is simply the 2024 version of economic uncertainty they have witnessed countless times before.
Historically, each of these previous versions has plotted its own unique course but the eventual outcomes have many characteristics in common – stronger economic performance, business growth, increased corporate profitability, house price gains, and long-term positive investment returns.
These outcomes aren’t necessarily all delivered at exactly the same time, as we have seen in the last six months, with share markets reaching new highs in spite of some less than stellar economic news. However, they can be expected on average, over time. This is why investors accustomed to investing for the long term can continue to have confidence in the progress they are making towards achieving their investment goals.
- Source: https://pages.stern.nyu.edu/~adamodar/ Historical Returns on Stocks, Bonds, Real Estate and Gold (for historical risk premiums). All returns referenced in the ‘Gold Rush’ section are in US Dollars.
- Source: Reserve Bank of New Zealand database and CoreLogic House Price Index data.