


Jan – Mar 2023
Investment Market Review
Following an upbeat end to 2022, investment markets continued to deliver generally positive returns over the first three months of 2023.
In an environment where energy costs were falling globally and the large Chinese economy began to reopen (after their abandonment of strict Covid-19 controls in late 2022), sentiment about the outlook for global growth was positive.
After months of co-ordinated central bank action to increase interest rates, headline inflation also looked to be slowly improving globally, raising expectations that the global interest rate hiking cycle could soon be coming to an end.
Unfortunately, measurements of ‘core’ inflation (i.e. the general cost of goods and services that excludes more volatile food and energy prices) stubbornly stayed higher than expected in both the US and Europe, indicating the interest rate tightening cycle still had further to run.
In early March, the collapse of Silicon Valley Bank in the US, followed a week later by troubled lender Credit Suisse being bought by global investment bank UBS, created significant, but short-lived, market turbulence.
Markets initially reacted to fears of a potential new banking crisis and bond markets quickly went from pricing in further interest rate hikes to pricing in sizable rate cuts in some markets.
However, by the end of the quarter, investors had largely concluded the events surrounding Silicon Valley Bank and Credit Suisse were contained and that any potential systemic risks were minimal.
China’s recovery accelerating
Less than six months ago, the Chinese economy was partly locked down with Covid restrictions and its economic performance was dwindling as a result.
Fast forward to today, and indicators are currently pointing to a solid recovery in Chinese economic activity. This renewed strength is directly contributing to an improved sentiment for global growth.
Notably, the current recovery in China is stronger than when they initially reopened earlier in the pandemic. This suggests a greater degree of confidence in the recovery this time around.
While this is good news for China it also bodes well for other economies, particularly those with a large trading relationship with China. Europe and Asia are well placed to benefit, and the Australian economy stands to be a direct beneficiary of improving volume and pricing for mineral exports, particularly iron ore and copper.
Global growth to rebound in 2024
In January, the International Monetary Fund (IMF) announced that while the global economy is poised to slow from a growth rate of 3.4% in 2022 to 2.9% this year, they are now projecting growth to rebound to 3.1% in 2024.
Although they noted the war in Ukraine and the global fight against inflation remained risks, the IMF nevertheless reported a mild upward revision to their October 2022 projections. In particular, they commented that the global economy had shown great resilience over the recent period and that a global recession is not their baseline view.
We are well acquainted with the difficulties in accurately forecasting the future, however this is still encouraging. At a minimum, it tells us that the wide-ranging economic data the IMF are basing their forecasts on are showing some overall improvement.
While it’s possible that China’s recovery could yet stall, inflation could persist at high levels and an escalation of the war in Ukraine could all contribute to a deterioration in financial conditions, the IMF also noted there were factors that could also lead to better-than-expected outcomes.
In particular, strong household balance sheets and robust wage growth could help sustain consumer demand. Additionally, an easing of the remaining supply bottlenecks, coupled with an easing in labour market pressures, could allow for a softer economic landing which would require less monetary tightening than is currently anticipated.
What is a soft landing?
The term “soft landing” refers to an objective of a central bank to slow down an economy and bring down inflation, while preventing the economy from falling into a recession. Recessions are generally defined as two consecutive quarters of negative growth, and are normally unwelcome as economic output, employment and consumer spending all come under increased pressure for a period of time.
To this end, the Reserve Bank of New Zealand (RBNZ), along with many other central banks, have implemented a series of interest rate hikes over the last eighteen months. The aim has been to try and rein in demand to slow down the rate of general price increases.
For many homeowners with mortgages, increasing interest costs on their home loan will generally lead to a reduction in spending in other areas, which will usually help reduce inflation overall.
Unfortunately, the approach is not without risk. In theory, raising interest rates eventually cools demand and brings down prices, but the mechanism is often described a ‘blunt tool’ with an uncertain impact. It can also take months for any subsequent change in consumer spending behaviour to be confirmed. This increases the chances that policymakers inadvertently overshoot and raise interest rates by more than they needed to. Clearly, it’s a very difficult balancing act.
Holding interest rates too low for too long helped create the current inflation problem. But if interest rates now rise too far, it increases the chance of a steeper economic downturn that more significantly impacts businesses and results in a larger spike in unemployment. That would broadly be described as a ‘hard landing’; the very outcome the RBNZ is striving to avoid.
Bonds – back to the future?
As we’ve attempted to explain in various communications over recent months, the painful outcome for investors in bonds in 2022 was highly unusual. This chart helps to provide some context.
The bars on the chart show the calendar year returns from global bonds1 (blue bars) and global shares2 (orange bars). The performances we are showing here are in US dollars, as that gives us a longer index data set than if we were showing the same information in New Zealand dollars. However, the picture would otherwise look very similar.
The main observations we can see at a glance (or within a few glances) are as follows:
- Bond returns are usually positive. Including 2013, when bonds were down by just
-0.1%, there have only been four years out of 33 when bonds have been negative. - In contrast, global share market returns are negative more often (nine years out of 33). This is consistent with shares generally being a higher risk investment. Similarly, we also see share returns delivering much larger positive and negative returns over time.
- What’s also very interesting is when we look at the nine years when shares delivered negative returns – 1990, 1992, 2000, 2001, 2002, 2008, 2011, 2018 and 2022. In all of these years except 2022, the corresponding return from bonds was positive.
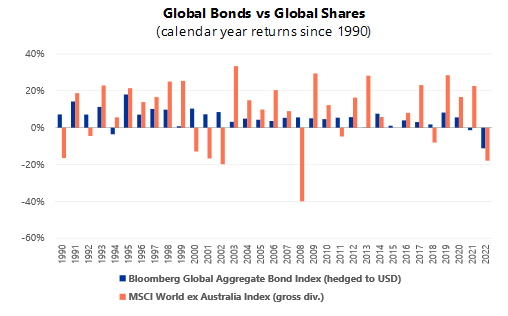
This last point is what made 2022 such an outlier in recent financial history.
It is always disappointing when share markets fall but it shouldn’t ever be a complete surprise. On average we should expect it to
happen about one year in every four. But having bond markets fall at the same time as share markets (and by as much as they did in 2022) was, as the graph shows, unheard of.
While last year’s correction is something all bond investors would prefer not to experience again, the benefit now is that many countries around the world (including New Zealand, USA, Germany and UK) have longer term interest rates back at levels they haven’t seen for the last 8-10 years, or longer.
This is a very strong indicator that bonds are now likely to revert to their traditional role in diversified portfolios, which is to provide positive returns to investors the next time share markets face another difficult year.
Stay focused on what works
We can’t predict the future, but we can continue to learn from the past.
As investment practitioners, we have helped clients successfully navigate some extremely difficult markets over the years. Each periodic “crisis” has been different, and each has been as unpredictable as the last, but the best solutions have almost always looked the same:
- Stay in touch with your adviser and stick with your plan.
- By all means change that plan when your circumstances change, but not in reaction to a sudden market event.
- Be focused on the things you can control.
- Keep investment costs as low as possible and stay as diversified as you can in relation to your risk profile.
- Tune out the media noise and any investment opportunities (or salespeople) that promise to consistently beat the market – the weight of evidence is not on their side.
We know markets will continue to go up and down; they always have. Importantly, most seasoned investors also understand that we can’t pursue the potential rewards of achieving higher investment returns without accepting some risk of periodic underperformance along the way.
When it comes down to long term investment planning, the good news is that the volatility we expect from markets over time (the mixture of good and bad returns) is already factored into our projections and your plan. As a result, when returns do occasionally disappoint, your adviser will rightly remind you – unless your circumstances have otherwise changed – to stick to the plan, because that is where any short term pain ultimately gets replaced with long term gain.
Key Market movements For the Quarter
Global share markets delivered further positive results in the first quarter, buoyed by a reduction in recession concerns across leading developed markets. That these gains came despite a sharp, but short-lived, elevation in fears across the global banking sector in early March, highlighted a degree of market resilience that was absent in 2022.
Bond markets also contributed positively to portfolio returns in the quarter as expectations began to grow that the interest rate tightening cycle, particularly in the leading US market, might soon be coming to an end.
That said, there are still risks to the forward view. In particular, many central banks are continuing to raise interest rates in pursuit of a soft economic landing – where they manage to slow the economy and inflation recedes, without an excessive impact on businesses or workers. It’s a very difficult undertaking to get just right, and the extent of their success will have a bearing over performance in the near term.
However, in the longer term, the prospects of a global economic recovery are slowly improving. And after several years of border closures, supply chain problems, labour shortages and a myriad of other economic frustrations, that’s an enticing thought.
+3.9%
The New Zealand market, as measured by the S&P/NZX 50 Index, backed up its solid +3.8% return in the last quarter of 2022 with another +3.9% return in the first quarter of 2023.
Five of the top 15 companies by market capitalisation, made strong contributions to the index performance this quarter – Fisher & Paykel Healthcare (+17.9%), Mercury NZ Ltd (+15.1%) and Auckland International Airport (+11.4%).
While these in particular were excellent results, the New Zealand market overall lagged most developed market counterparts. This was likely a reflection of the ongoing economic uncertainty locally which was underscored by the announcement in March that New Zealand’s GDP fell by 0.6% in the fourth quarter of 2022.
While winners outnumbered losers within New Zealand’s top 50, a couple of notable returns on the downside included a2 Milk which gave up much of last quarter’s gains by posting -15.5%, and Heartland Group Holdings which fell -10.3%, in what was a weak quarter for most banking companies globally.
Source: S&P/NZX 50 Index (gross with imputation credits)+2.4%
In keeping with the trend overseas, the Reserve Bank of New Zealand (RBNZ) raised the Official Cash Rate (OCR) by a further 0.50% in February following the larger 0.75% rise in November.
In their 22 February statement, the RBNZ noted that the outlook for global activity in 2023 remains subdued, which is acting to lower global consumer pricing pressures as well as demand for New Zealand’s key commodity exports. However, core inflation remains high internationally and inflationary pressures remain broad based.
What the statement did not contain was any suggestion that the previously outlined monetary policy track would be subject to any adjustment. Over the quarter to 31 March, the New Zealand 10 year bond yield declined from 4.55% to 4.23%.
The S&P/NZX A-Grade Corporate Bond Index rose +2.4% for the quarter, while the longer duration but higher quality S&P/NZX NZ Government Bond Index gained +2.5%.
Source: S&P/NZX A-Grade Corporate Bond Index
+1.8%
NZ REITs had a small bounce back in this quarter with positive momentum elsewhere in the market.
However, this bounce is small relative to the falls seen last year.
As with previous quarters, concern remains about the implications of current interest rates and likely changing tenancy requirements across the sector. With property valuations being sensitive to changes in both net rental income levels and market capitalisation rates, it is understandable why property share prices have depreciated over the last 18 months. However, there are signs of cap rates increasing recently. If interest rates do return to lower levels the additional yield from listed property may come back in favour.
Stride Property and Argosy were the poorest performing REITs returning -6% and -3.1% respectively for the quarter while Goodman Property and Vital Healthcare Property returned +6.8% and +5.3% respectively.
Source: S&P/NZX All Real Estate Index.
+3.1%
The Australian share market (ASX 200 Total Return Index) began the year in similar fashion to New Zealand by delivering a +3.1% result for the first quarter.
Within the top 100 companies which drive the bulk of the index returns, materials sector firms (Liontown Resources +95.5% and Newcrest Mining +32.6%) delivered outstanding gains.
Liontown, a battery metals exploration firm, saw their shares jump by over 50% in a day after the company rejected a series of takeover proposals from Albemarle Corporation, the largest provider of lithium for electric vehicle batteries in the world.
In what was generally a productive quarter for technology firms globally, Wisetech Global (+28.5%) and Xero Ltd (+27.3%) also delivered significant gains.
At the other end of the spectrum, shares in coal mining company Whitehaven Coal fell
-25.2% following significant weakness in the coal price during the first quarter, while financial services firm Computershare Ltd declined -16.5%.
Although the index return in Australian dollar terms was slightly higher at +3.5%, the reported returns to unhedged New Zealand investors declined a little due to a slight strengthening in the value of the New Zealand dollar (versus the Australian dollar) over the quarter.
Source: S&P/ASX 200 Index (total return)
+5.6%
The emerging markets posted solid positive returns over the first quarter although lagging the general returns from developed markets.
The start of the year brought renewed optimism for the emerging markets, given the
re-opening of the Chinese economy. However, February and March saw a re-escalation in US-China tensions, highlighted by the shooting down of a Chinese high-altitude balloon in US airspace. Despite this, the Chinese share market still delivered a return similar to the emerging markets index during the quarter.
A number of individual emerging countries, headed by the Czech Republic, produced strong double-digit returns for the quarter. The Mexican market performed well against a backdrop of improving economic data while more significant players Taiwan and Korea, seen as beneficiaries of the improving optimism about global growth, were amongst the other strong contributors.
The Brazilian market was down against a backdrop of softening economic data and anti-government riots that damaged government buildings in January. India also generated negative returns amid allegations of fraud and share price manipulation at a major Indian conglomerate early in the quarter.
In aggregate, it was a good performance by the emerging markets group in their local currencies, and the slightly weaker New Zealand dollar over the quarter meant the MSCI Emerging Markets Index produced a quarterly return of +5.6% in unhedged New Zealand dollar terms.
Source: MSCI Emerging Markets Index (gross div.)
+7.5% (hedged to NZD)
+9.5% (unhedged)
US and Eurozone share markets made further strong gains in the first quarter, despite increased volatility in the banking sector.
In early March, the collapse of Silicon Valley bank in the US, followed by the swift buyout of Credit Suisse by UBS initially sparked concerns about the potential for another global banking crisis. These concerns were quickly allayed after the Federal Reserve expressed confidence in the resilience of the US banking system and the Swiss authorities were equally alert in assisting with the takeover of Credit Suisse.
By quarter end, the early March wobbles were a fading memory and the share markets ended the month positively on the back of improving investor sentiment.
The UK share market was also higher, aided by the news that the UK’s latest quarterly GDP data was better than expected and that the UK economy had avoided a technical recession in the fourth quarter of 2022.
Against major currencies, the New Zealand dollar was a little weaker through the quarter which meant increased reported returns for investors holding unhedged foreign assets.
The MSCI World ex-Australia Index delivered a healthy return of +7.5% for the quarter hedged to the NZ dollar, and +9.5% for the unhedged index.
Source: MSCI World ex-Australia Index (net div.)
+1.6%
During the first quarter, the positive sentiment on the growth outlook improved, and some of the headline inflation pressures showed signs of abating, in particular as energy prices weakened. However, core measures of consumer price inflation (which exclude food and energy) delivered upside surprises in both the US and Europe. While there were signs that interest rate hiking cycles were already biting in many regions (particularly within housing markets), the downstream impacts on broader economic performance are still to be revealed.
Central banks continued with their rate rising programmes, although some adjusted their stance. The US Federal Reserve announced two rate hikes in the quarter of 0.25% each, marking a slowdown from their last six adjustments of either 0.50% or 0.75% each. The Bank of England also approved two hikes of 0.50% and 0.25% respectively, while the European Central Bank remained more aggressive by comparison and raised rates twice in 0.50% increments. The Bank of Canada enacted a rate hike of 0.25% but signalled a pause immediately upon doing so, while the Bank of Japan made no further adjustments to its yield curve control policy, despite core inflation rising.
Against this backdrop bond markets were relatively volatile with widening credit spreads, meaning US and European investment grade bonds generally underperformed government bonds.
Over the quarter, the US 10 year bond yield declined from 3.88% to 3.47%, with the two year bond yield similarly retreating from 4.43% to 4.04%. Germany’s 10 year bond yield fell from 2.56% to 2.30%, while the UK 10 year yield decreased from 3.67% to 3.49%.
The US dollar was weaker against most of its G10 peers over the quarter, driven by changes in rate hike expectations.
The FTSE World Government Bond Index 1-5 Years (hedged to NZD) returned +1.6% for the quarter, while the broader Bloomberg Global Aggregate Bond Index (hedged to NZD) advanced +2.7%.
Source: FTSE World Government Bond Index 1-5 Years (hedged to NZD)
+3.2% (global property)
+0.1% (global infrastructure)
The international property sector bounced back in the March quarter as it returned +3.2% in NZD terms. In the quarter, Australia REITs returned -0.1%, U.S REITs 4.3%, and Japanese REITs -3.9% in NZD.
International Infrastructure
The FTSE Developed Core Infrastructure Index returned +0.1% in AUD terms over the quarter.
The largest asset allocations within the index at the end of December were Conventional Electricity at 35.8%, Railroads at 19.2%, Pipelines at 13.9% and multi-utilities at 11.8% of the index. The largest investments in the fund are NextEra Energy at 6.8% and Union Pacific Corp at 5.5%.
Source: S&P Developed REIT Index, FTSE Developed Core Infrastructure Index in AUD
Asset Class Returns To 31 March 2023
| Asset Class | Index Name | 3 mths | 1 year | 3 years | 5 years | 10 years |
|---|---|---|---|---|---|---|
| New Zealand shares | S&P/NZX 50 Index, (gross with imputation credits) | +3.9% | -1.0% | +7.4% | +8.3% | +11.5% |
| New Zealand property | S&P /NZX All Real Estate Index (Gross) | +1.8% | -15.7% | +2.2% | +5.0% | +7.1% |
| Australian shares | S&P/ASX 200 Index (total return) | +3.1% | -0.9% | +17.9% | +8.8% | +6.5% |
| International shares | MSCI World ex Australia Index (net div., hedged to NZD) | +7.5% | -7.3% | +15.6% | +8.0% | +10.4% |
| MSCI World ex Australia Index (net div.) | +9.5% | +3.1% | +14.5% | +11.2% | +12.2% | |
| Emerging markets shares | MSCI Emerging Markets Index (gross div.) | +5.6% | -0.6% | +6.5% | +2.4% | +5.4% |
| International property | S&P Global REIT Index (Gross div.) | +3.2% | -10.7% | +8.2% | +6.5% | +7.4% |
| New Zealand fixed interest | S&P/NZX A-Grade Corporate Bond Index | +2.4% | +0.1% | -1.1% | +1.3% | +3.1% |
| International fixed interest | FTSE World Government Bond Index 1-5 years (hedged to NZD) | +1.6% | -0.8% | -0.9% | +0.9% | +2.2% |
| International fixed interest | Bloomberg Global Aggregate Bond Index (hedged to NZD) | +2.7% | -4.8% | -2.4% | +0.6% | +2.9% |
| New Zealand cash | New Zealand One-Month Bank Bill Yields Index | +1.2% | +3.6% | +1.5% | +1.5% | +2.1% |