Oct-Dec 2022
Investment Market Review
 The last quarter of 2022 provided some welcome bright spots in investment markets.
Even with a supply of negative news headlines, such as:
- The highest inflation in four decades
- Interest rates are rising rapidly
- Ongoing war in Ukraine
- Lockdowns in the world’s second-largest economy
- A slowdown in the housing market
Many markets went up.
All of the 23 developed markets in the MSCI World Index were positive over the quarter, and 19 went up by at least 6% (in local currency terms). A similar story unfolded in emerging markets, where 14 of the 24 nations in the MSCI Emerging Markets Index rose by more than 6%. The gains in emerging markets were not uniform, with six emerging nations dipping into the red for the quarter.
The obvious question is, why? What do the markets know that we don’t?
The aggregate market is made up of individuals, trusts, companies, professional investors, and a wide range of institutional investors. While individual investors can sometimes react poorly to the constant media ‘noise’, and occasionally make knee-jerk decisions to sell, investors who are committed to seeking longer-term investment outcomes are often better able to block out this noise and focus on the value of the underlying assets.
When markets become difficult, investors who are easily influenced by emotion, uncertainty, or fear are prone to making bad decisions. But for every panicked seller, we need to remember there is always a buyer (often more considered) taking an
equal and opposite view.

During 2022, the prices of many good-quality investments had reduced to the point that, in aggregate, market participants began to regard them as being relatively cheap. And for most long-term investors, ‘quality’ plus ‘cheap’ equals an attractive investment opportunity.
Sure, there were (and are) many uncertainties in the world, and the list above covers most of the big ones. But investors looking to own high-quality assets for the long term don’t need to be quite so concerned about exactly when interest rates might stop rising, when housing prices will stabilise, or even when the war in Ukraine will end.
At some point (hopefully sooner rather than later), most investors believe that all of these things will happen. And, when viewed through that lens, it’s easier to understand how the asset prices available at the beginning of the September could generally be considered attractive, regardless of what was still going on in the world around us.
Fighting inflation
The cost of living crisis was one of the big talking points of 2022, with prices, particularly at the supermarket and at the petrol pump, rising uncomfortably quickly at times.
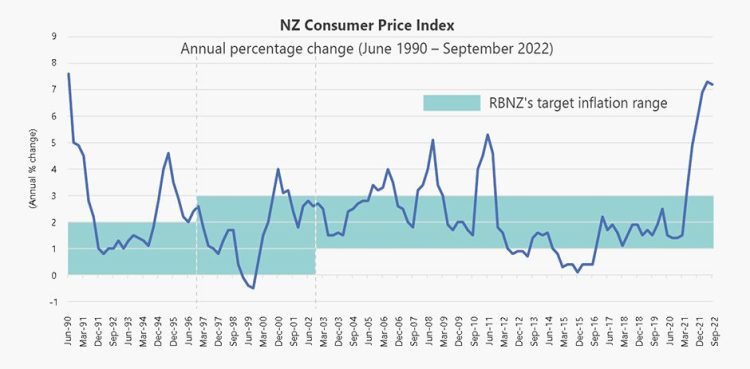
Having successfully controlled inflation within its target range of 1-3% over most of the last decade (as the following chart shows), the Reserve Bank of New Zealand (RBNZ) had also very effectively managed our collective inflation expectations. That is, we all generally expected average inflation of around 2% (give or take) to persist into the future, and our spending and investment behaviours reflected those expectations.
However, following the post-COVID-19 surge in inflation from 2021 to the current level of 7.2% pa (as at 30 September 2022), the RBNZ has become increasingly concerned about the risk of a potential ‘de-anchoring’ of our collective inflation expectations. In other words, they are concerned that we may begin to expect much higher levels of inflation in the future than we had previously.
If we begin to expect higher inflation, this is likely to impact our decision-making in relation to savings, investment, and spending. It is also likely to impact other areas, such as wage negotiations, putting pressure on wages to continue to rise higher and higher to meet rising costs. This, in turn, fuels the inflationary pressures we are already facing.
If our inflation expectations were to be reset at higher levels, it would present a much bigger challenge for the RBNZ to quickly get price inflation back down towards the levels we had previously been experiencing.
Galvanised by these concerns, the RBNZ hiked New Zealand’s official cash rate (OCR) by another 0.75% at their November meeting to 4.25%, and revised their projection for the OCR to now reach a peak of 5.50% in 2023. This revised peak is a full 1.40% above the OCR forecast of 4.10% from their August announcement.
How successful the RBNZ is at curbing inflation will be something to watch this year. The chart shows that when inflation has historically reached a short-term peak of 4% or more, it has subsequently fallen reasonably quickly (usually after the RBNZ has moved interest rates higher).
If something similar can be achieved within the next one or two inflation updates, there is still a chance the projected OCR peak of 5.50% may not be required. For now, we watch and wait for more inflation data.
It should also be noted that with much of the global economy experiencing similar inflationary issues, the coordinated interest rate rising that is occurring around the world will act as a headwind to global growth in 2023. If that headwind blows too hard for too long, it increases the chances that we will see a period of lower or negative growth in some countries/regions later this year. Clearly, a delicate balancing act for central banks around the globe.
The energy sector outperforms
While it wasn’t a good year overall for share markets, there was one standout performer – the energy sector.
>Higher oil and gas prices were a feature of the year, and it was one of several factors that contributed to rocketing global inflation. Although higher oil prices are generally bad news for consumers and travellers, it was great news for the energy industry (and its investors). As oil prices soared, so too did the performance of many listed energy companies.
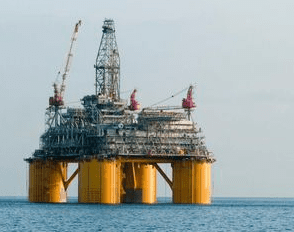 In the US, the energy sector returned more than 65% in 2022 – its best year on record – and in Europe, it was also easily the leading sector, up more than 37%. These returns are even more remarkable in a year when global share markets were broadly negative.
This represented a dramatic turnaround from the depths of 2020, when the energy sector was initially the largest casualty of the global shutdown that followed the arrival of the Covid-19 pandemic.
A much better outlook for bonds
The combination of rising interest rates and higher inflation in 2022 led not only to a bear market in shares but also to the worst year for bonds in modern financial history.
>As interest rates rose faster and further than all early predictions, bond prices declined by significantly more than we are accustomed to. As the year wore on, it led to some investors considering potential alternative assets, particularly ones that could also help to offset traditional share market risk.
However, just as investors may be starting to lose faith in the role that bonds play within diversified portfolios, the forward-looking prospects for bonds are now better than they have been in years.
As at 30 December, the S&P/NZX A-Grade Corporate Bond Index in New Zealand had a running yield of 5.4%, while the Global Aggregate Bond Index was yielding 4.9% in New Zealand dollar hedged terms (having touched over 5% in recent months).
With central banks now well into their interest rate tightening cycles, early signs of global inflation beginning to moderate, and consumer demand seemingly softening, we have an environment for stronger bond returns than we have seen in recent years.
Also noteworthy is that bond yields are now at levels where they have room to rally (i.e., room for bond prices to rise) if, for example, a non-inflationary macroeconomic shock were to occur and policymakers were to respond by lowering interest rates.
This more positive outlook may be tempered a little by the fact that the large government deficits that built up during the early and mid-stages of the COVID-19 pandemic are likely to remain elevated for some time. Even if governments are successful in taking a more frugal approach to future spending, they will need to continue selling more bonds to the private sector, and that will be happening in a financial system with reduced overall liquidity. This could limit the scope for bond yields to decline as much as headline inflation falls back from peak levels.
However, even in a scenario where bond yields may remain more consistently at or around their current levels, the running yields alone, as outlined above, make them an attractive component of diversified portfolios.
All eyes on 2023
The final quarter of 2022 provided a positive end to an otherwise challenging year for investors.
It was encouraging that in spite of the lack of clarity on a number of high-profile macroeconomic and geopolitical issues, the markets were able to look through these matters and conclude that many asset prices were increasingly looking attractive.
One strong quarter in no way guarantees that the recent challenging market conditions are fully behind us, but it is a positive sign, and it takes us into the new year with more reason for optimism about the potential for better times ahead.
Suppose the uneven transition from COVID lockdowns to a global economic reopening has shown us anything. In that case, it’s that governments, central banks and investment markets don’t have a proven playbook about how to seamlessly return the world back to its pre-Covid state. As a result, the last few years have thrown up economic outcomes and market eccentricities that have been well outside our normal expectations.
With the potential for inflation pressures to ease in 2023 and for interest rates to stabilise, it is not unreasonable to hope that some of these eccentricities also begin to moderate.
>In the meantime, when markets are as difficult to navigate as they have been lately, the very best approach is always to stay invested, stay well diversified, keep costs low, and stay patient.
Key Market Movements for the Quarter
After such a challenging first three quarters of 2022, it was difficult to imagine the final quarter would deliver anything substantially different. As they say, however, it is always darkest before the dawn. With no new risks surprising or alarming markets, and the impact of significant and ongoing tightening of monetary policy starting to be reflected in reduced rates of inflation, market participants started to consider when recent rate hikes could begin to be pared back. With tentative optimism that this rate rising cycle might end sooner than expected, November in particular saw strong performances in both shares and bonds, helping propel the final quarter of the year into the positives.
Unemployment remains low, GDP growth beat estimates, inflation has slowed (a little), and the corporate earnings reporting season was strong in many sectors, all of which contributed to positive returns.
Many central banks, in particular the US Federal Reserve (the Fed), reduced the speed at which they have been increasing interest rates. Although the Fed’s final announcement of the year warned of difficulties still to come for the economy, it also stated that the interest rates were far from their peak level in this cycle. That halted the emerging ‘Santa rally’ in early December, and the last month of the year was generally weaker. Regardless, the quarter overall was generally positive across the board, which helped claw back some of the market weakness from earlier in the year.
![]()
+3.8%
New Zealand Shares
The New Zealand market, as measured by the S&P/NZX 50 Index, shook off a negative October to post a welcome gain of +3.8% for the quarter. Unfortunately, the index still recorded a -11.3% return for the year, remarkably, the first negative calendar year for the NZ share market since 2008.
Three of the top 15 companies by market capitalisation made strong contributions to the overall index performance – Fisher & Paykel Healthcare (+23.1%), a2 Milk (+20.6%), and Ebos Group (+16.7%). For A2 Milk and Fisher & Paykel in particular, both of which had their share prices under some pressure at different times throughout the COVID disruptions, it was a very pleasing result.
At the other end of the spectrum, a trio of Healthcare companies: Ryman (-36.5%), Arvida (-19.1%), and Summerset Group (-17.9%) all struggled, continuing a downward trend in the performance of each of these shares over the last 18 months.
Source: S&P/NZX 50 Index (gross with imputation credits)
![]()
+0.2%
New Zealand Fixed Interest
The Reserve Bank of New Zealand (RBNZ) raised the Official Cash Rate (OCR) twice more in the fourth quarter, taking this benchmark rate to 4.25%.
In their 23 November statement, the RBNZ noted that to meet its policy remit of low annual inflation while supporting maximum sustainable employment, both ‘actual and expected’ inflation needed to decline substantially. Accordingly, given the extent to which domestic spending was contributing to higher and more persistent actual and expected inflation outcomes, the RBNZ determined that a November rate hike of 0.75% to 4.25% was warranted and revised their projections for a higher OCR peak (now targeting 5.50%) in 2023.
Similar to the broad trends overseas, the New Zealand 10-year bond yield opened the quarter at 4.29%, briefly touched 4.00% in early December, and finished the quarter at 4.55%.
The S&P/NZX A-Grade Corporate Bond Index rose +0.2% for the quarter, while the longer duration but higher quality S&P/NZX NZ Government Bond Index gained +0.1%. Both indices ended the year well down at -5.1% and -9.1% respectively.
Source: S&P/NZX A-Grade Corporate Bond Index
![]()
New Zealand Property
NZ REITs had another negative quarter, down by -3.6%.
Market announcements during the quarter showed NZ REITs pushing out expectations for new developments. There were some divestments in the quarter, with KPG and SPG announcing divestment plans. PCT is also divesting its Wynyard Stage 3 development.
Listed property shares at current prices appear “cheap” with gross dividends ranging from 4.% to 8.6%, averaging 6.2% p.a., and the valuation across the sector is trading at a 25% discount to NTA.
As with last quarter, concern remains about the implications of current interest rates and likely changing tenancy requirements across the sector. With property valuations being sensitive to changes in both net rental income levels and market capitalisation rates, it is understandable why property share prices have depreciated over the last 18 months.
However, if interest rates do return to lower levels, the additional yield from listed property may come back in favour.
Stride Property and Vital Healthcare were the poorest performing REITs, returning -13.4% and -10.6% respectively for the quarter, while Goodman Property and Kiwi Property returned +1.9% and +1.3% respectively.
Source: S&P/NZX All Real Estate Index.
![]()
+2.6%
Australian Shares
The Australian share market (ASX 200 Total Return Index) closed out a relatively robust year, delivering +9.4% in local currency terms through the quarter.
This strong quarterly result is less surprising when the two largest components of the index – BHP Group and Rio Tinto – delivered returns (in Australian dollars) of +18.5% and +24.7% respectively. Both of these mining firms have benefited considerably from a more than 50% rally in iron ore prices since the beginning of November.
Other large index constituents include the ‘Big Four’ banks (CBA, NAB, Westpac, and ANZ), which all delivered quarterly returns ranging from +7.0% to +16.2% as their revenue expectations continue to benefit from a higher interest rate environment.
Although the Australian share market was strong overall, the reported returns to unhedged New Zealand investors were much lower due to the relative strength of the New Zealand dollar over the quarter. For the full 2022 calendar year, the ASX 200 was slightly negative (-1.1% in AUD and -0.1% in NZD terms). However, relative to most other asset classes, the ASX was a very resilient performer during a highly challenging period for investment markets.
Source: S&P/ASX 200 Index (total return)
![]()
-3.2%
Emerging Markets
The relaxation of COVID-19 restrictions in China and the weakening of the US dollar were the main themes in emerging markets through the quarter, driving up returns in local currencies. The headline MSCI Emerging Markets Index gained +9.8% for the quarter in US dollar terms.
Investors welcomed the relaxation of China’s COVID-19 regulations, which helped boost optimism regarding an earlier-than-expected reopening of the economy. This propelled the Chinese share market to a double-digit return, and via its significant weight, was the main driver of the strong index returns.
Poland and Hungary also rebounded strongly following months of underperformance resulting from the war in neighbouring Ukraine.
Weaker energy prices over the quarter led to Middle Eastern markets generally underperforming, with soccer world cup hosts Qatar, stumbling to a double-digit decline for the quarter.
Although these results were very good in local currency, the strong New Zealand dollar meant the MSCI Emerging Markets Index produced a quarterly return of -3.2% in unhedged New Zealand dollar terms and finished the year down -13.4%.
Source: MSCI Emerging Markets Index (gross div.)
![]()
+7.1% (hedged to NZD)
![]()
-3.4% (unhedged)
International Shares
US, Eurozone, and UK share markets all made strong gains in the quarter, with much of the progress made in November. Investors were generally balancing ongoing central bank caution with signs that elevated global inflation could begin to ease, and indications that the current pace of policy tightening would slow.
Gains in the UK were also helped, in part, by the country emerging from its September crisis when the former prime minister and chancellor announced huge fiscal stimulus, with little detail on how it would be funded.
In a reversal of recent price action, the New Zealand dollar was firm through the quarter. While this was good news for anyone buying foreign currency over the holidays, it was not so good for investors holding unhedged foreign assets, as these holdings, when reported in New Zealand dollar terms, are worth less. Conversely, any NZD-hedged securities were insulated from this, and given the volatility in currency markets in 2022, it underlines the perils of being fully hedged or fully unhedged in these highly unpredictable times.
The MSCI World ex-Australia Index delivered a return of +7.1% for the quarter hedged to the NZ dollar, and -3.4% for the unhedged index. This meant the 2022 calendar year return for the New Zealand dollar hedged index ended down -17.9%, while the unhedged index returned -12.0%.
![]()
+0.5%
International Fixed Interest
Bond markets ended the year on a mixed note in the final quarter. Government bond yields edged higher towards the end of the year, reflecting some disappointment at the still hawkish tone from some central banks, despite mounting evidence of slowing economic growth.
The US Federal Reserve raised interest rates twice during the quarter, with the Fed Funds rate ending the year at 4.5%. The Bank of England also announced two rate hikes, bringing the UK interest rate to 3.5%, while the Bank of Japan announced a modification to its yield curve control policy.
Credit spreads (the extra return investors need to encourage them to invest in bonds with lower credit quality) generally tightened across the quarter on improved risk sentiment. This resulted in US and European investment-grade bonds generally outperforming government bonds.
The eurozone faced its most challenging year for inflation in its history, although indicators late in the year signalled slowing headline inflation, helped by falling energy price pressures. Nevertheless, the European Central Bank (ECB) continued to tighten monetary policy conditions and maintained its aggressive stance on future rate hikes.
Over the quarter, the US 10-year bond yield rose from 3.83% to 3.88%, with the two-year bond yield rising from 4.27% to 4.43%. Germany’s 10-year bond yield increased from 2.11% to 2.56%.
The UK 10-year yield decreased from 4.10% to 3.67%, after the country’s new prime minister reversed most of his predecessor’s ‘mini budget’ proposals, which the markets had very poorly received.
The FTSE World Government Bond Index 1-5 Years (hedged to NZD) returned +0.5% for the quarter and -4.6% for the year. The broader Bloomberg Global Aggregate Bond Index (hedged to NZD) advanced by 0.8% in the quarter but declined by 11.7% for the year, marking the worst calendar year for this asset class.
Source: FTSE World Government Bond Index 1-5 Years (hedged to NZD)
![]()
-5.5% (global property)
![]()
+2.9% (global infrastructure)
International Property
The international property sector had another poor quarter as it returned -5.5% in NZD terms. We note this is largely the result of a stronger NZD over the quarter as the index returned +7.2% in USD terms.
In the quarter, Australia REITs returned 16.5%, U.S REITs 5.3%, and Japanese REITs 5.3% in local currency terms.
International Infrastructure
The FTSE Developed Core Infrastructure Index returned +2.9% in AUD terms over the quarter.
The index returned +8.8% in USD terms. The largest asset allocations within the index at the end of December were Conventional Electricity at 35.2%, Railroads at 19.9%, Pipelines at 14.1% and multi-utilities at 14.1% of the index.
Source: S&P Developed REIT Index, FTSE Developed Core Infrastructure Index in AUD