Investment Market Review
These signs of optimism may also give global policymakers additional confidence that their efforts to contain inflation without causing more serious economic harm, may be working. However, global growth remains weak by historical standards, and IMF economists warned that significant risks still exist, as the recovery from the pandemic and Russia’s invasion of Ukraine has been very slow. The succinct appraisal from IMF Chief Economist Pierre-Olivier Gourinchas, is that the global economy is “not yet out of the woods”.
Although the economic environment continues to require careful navigation by policymakers, the IMF raised its forecast for global growth this year to 3% (up from 2.8% in April). It also predicted that global inflation would continue to ease from 8.7% in 2022 to 6.8% this year and 5.2% in 2024, as the effects of higher interest rates filter throughout the world.
The outlook was rosier in large part because financial markets – which had been shaken by the collapse of several large banks in the United States and Europe earlier in the year – have largely stabilised. Sadly, as we go to print, Palestinian militant groups led by Hamas launched a large-scale invasion against Israel from the Gaza Strip, triggering a swift response from the Israeli military. While geo-political conflict tends not to directly impact markets, all independent observers will be hoping for a speedy resolution.
Key commodity prices weaken
Weakening trading-partner demand, driven by the slowing Chinese economy, has resulted in a significant decline in New Zealand’s commodity export prices in recent months, none more so than in the dairy sector.
In early August, Fonterra reduced its 2023/24 season milk price forecast by one dollar to a mid-point of $7 per kg of milk solids. Given the sheer volume of milk solids that Fonterra collects each year, this equates to 0.4% of New Zealand’s gross domestic product (GDP) before any indirect economic effects are considered. Some economists suggest the total impact on the economy could be as much as 4 to 5 times the direct effect.
The forecasted price of $7 per kg of milk solids is 15% lower than last season’s price and also below most estimates of a breakeven rate. This is noteworthy because dairy is our largest export, making up almost a third of New Zealand’s total goods exports.
Other key export prices for lambs and logs have also been under pressure from slowing demand. Unfortunately, while prices have been weakening, farm costs have been moving in the other direction, increasing the pressure on our agricultural sector.
These price declines pose a challenge for the wider New Zealand economy as lower export revenues are likely to have a negative impact on overall economic activity.
Housing decline over?
On the flip side, the local housing market has finally shown some positive signs of stabilising.
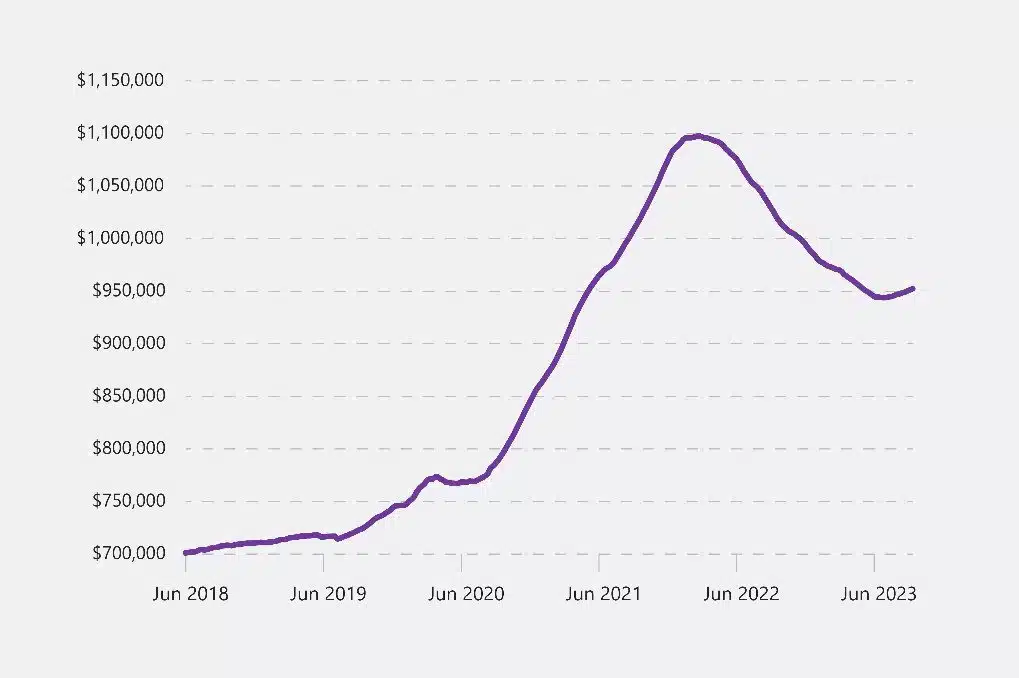
Figure 1: New Zealand’s average property value since June 201.
From August 2020 to February 2022, with our international borders still closed, and as the New Zealand economy reoriented itself after the national Covid lockdown, the average value of the local housing market increased by just over 40% in 18 months.
This turned around over the following 16 months to June 2023 as New Zealanders finally got their boarding passes again, mortgage interest rates began to rise quickly and inward migration flows remained frustratingly weak.
Today, with inward migration numbers very much higher again (adding further weight to housing demand) and interest rates having stabilised, housing values have slowly begun to pick up again. For many who have their total net worth closely linked to the value of their home, this has been a ray of sunshine in an otherwise challenging economic environment.

Interest rates stabilised
The Reserve Bank of New Zealand (RBNZ) continues to believe it has done enough to get inflation back under control. Across the 12 July, 16 August and 4 October Monetary Policy decisions, the RBNZ left the Official Cash Rate (OCR) unchanged at 5.50% and made only very small changes to its forward-looking OCR forecast. This demonstrates a degree of confidence within the RBNZ that, even with current inflation still elevated, it remains on track to achieving its inflation target.
The RBNZ believe current level of interest rates is limiting spending and reducing inflation pressures and headline inflation is tracking downward. This has been largely driven by a useful fall in ‘tradables’ inflation, which measures the price changes for goods and services that are more exposed to international competition. Unfortunately, inflation on the goods and services we use daily such as construction, rents, restaurant meals and ready-to-eat food, etc is reducing much more slowly.
Inflation in this area (non-tradables) is proving to be a bit ‘stickier’ than the RBNZ originally hoped, however there is an emerging consensus that overall inflation is at least heading in the right direction. A number of commentators are suggesting this could lead to reductions in the OCR from early next year, even though the RBNZ’s own forecasts suggest this might not happen until 2025.


Diversification remains valuable
Since the emergence of Covid-19 back in early 2020, global asset markets have generally experienced some degree of upheaval. At the beginning of the pandemic, global share markets capitulated over the first few weeks of March 2020 before embarking on a searing rally. In the case of the New Zealand NZX 50 Index, this rally was so strong that by September 2020, it had recovered all of its lost ground from earlier in the year.
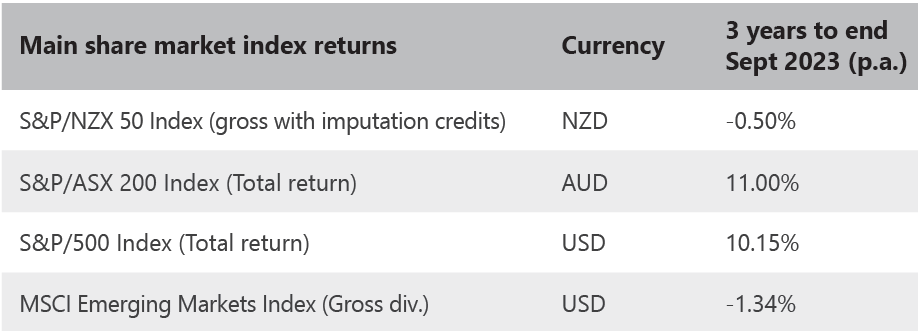
So, what has happened in the three years since then? As the table on the next page shows, it’s been a relatively underwhelming period for New Zealand shares, with the local index (including dividends) having ground out a small annualised loss for the period. With the benefit of hindsight that’s not a shocking discovery. The small New Zealand economy was slower to reopen to the rest of the world and has since been on the back foot trying to compete for much-needed skilled labour in what has suddenly appeared to be a global labour market shortage.


For investors with all their growth assets in New Zealand, that wouldn’t have been a great result, but for diversified global investors the story has probably been more positive.
The neighbouring Australian share market (ASX 200) and the globally significant US share market (S&P 500) both delivered excellent returns over the same three year period, rewarding investors who were mindful not to have all their growth exposures in New Zealand.
Outside of global shares, a number of other asset classes also struggled.
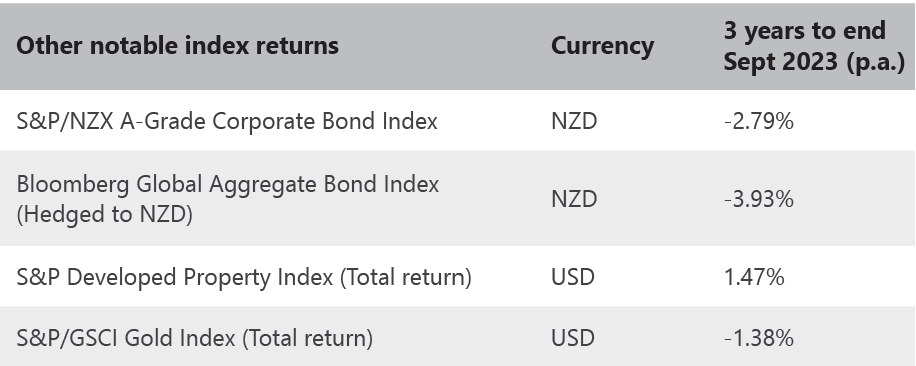
Bond markets in New Zealand (A-Grade Corporate Bond index) and internationally (Bloomberg Global Aggregate Bond index) all laboured as global interest rates generally rose. Global listed property produced a weak positive return, while gold – often touted as a safe haven in times of market trouble – could only deliver a small negative return.
While Bitcoin did very well (initially), its highly speculative properties make it an unsuitable holding for most investors, something which its price decline of -60% since October 2021 probably confirms.


If in doubt, stick to the plan
With international inflation pressures slowly receding and the outlook for global growth looking slightly brighter, investors can take a little bit of heart.
The last few years have been a period unlike any we’ve experienced previously, with the global economy effectively shutting down for a period of time and no rule book on how to get it successfully restarted. Perhaps not surprisingly, the economic transition back from the depths of the pandemic has been far from painless.
In New Zealand alone over the last three years we’ve witnessed rampant house prices (followed by rapidly falling house prices), galloping inflation, a cost-of-living crisis and extreme labour shortages. We have, however, endured. And well diversified investment portfolios have endured as well – particularly those containing at least a scattering of traditional international growth exposures.
To the layperson, investing through the ‘good times’ is often considered easy – when just having your money somewhere will end up giving you a good return. However, it’s when navigating the ‘difficult times’, that a robust strategy and good investor behaviour will often pay the biggest dividends. That doesn’t necessarily mean earning higher returns, but it almost always means helping investors avoid the pitfalls of succumbing to short term (emotionally driven) thinking and bad decision-making. Doing the wrong thing at the wrong time is the surest way we know to undermine even the smartest strategy.
The challenge is that no matter how obvious everything seems in hindsight (once events have happened and their consequences are known), its usually impossible to know which period – good or bad – lies immediately ahead. All we have is the certainty that both will make an appearance at different times and, on average, there will be more good than bad.
That’s why building a sound long term investment strategy is so important. One that allows someone to stay invested when the going gets tough, so they are in the best position to benefit from the inevitable recovery.
Key Market Movements for the Quarter
After a generally good performance over the first half of 2023, international share markets gave up some of their gains in the July to September quarter. Slowing growth and the prospect of a sustained period of higher interest rates in the US weighed on the influential American share market, with the so called “magnificent seven” large technology-related businesses mainly declining.
Despite production cuts from Saudi Arabia and Russia contributing to a significant rise in oil prices, there was better news on the inflation front, with year-on-year core inflation measures continuing to ease across most economies. This allowed many major central banks to indicate a pause in their rate hiking programmes.
In August, Fitch Ratings downgraded the US’s triple-A sovereign credit rating to double-A plus, citing the growing US debt burden and an “erosion of governance” as reasons for its decision. This, combined with market expectations for interest rates to remain higher for longer, contributed to higher yields (lower bond prices) over the quarter.
The New Zealand share market, as measured by the S&P/NZX 50 Index, underperformed international markets over the quarter by delivering a -4.8% return. While a number of small companies outside the top 50 performed strongly, several of the more ‘index-relevant’ names didn’t fare quite so well. Unfortunately, losers outnumbered winners on the NZX this quarter.
Of the more notable firms, Restaurant Brands NZ Ltd (franchise owner for KFC, Pizza Hut, Carl’s Jr and Taco Bell) projected weaker than expected profitability due to ongoing global inflationary pressures, particularly in regard to rising ingredient and wage costs. Restaurant Brands shares slumped -31.2% over the quarter.
The a2 Milk Co Ltd also slid for the third successive quarter, shedding a further -14.8%. While the firm met the lower end of its guidance for double-digit revenue and earnings growth, it warned the key China market will be more challenging this year with China’s birth rate at a record low. The infant formula producer flagged prices will remain under pressure due to an increase in competition, excess manufacturing capacity and challenging macroeconomic conditions.
Source: S&P/NZX 50 Index (gross with imputation credits)
New Zealand Fixed Interest
Having raised interest rates faster throughout 2022 than all major economies, the Reserve Bank of New Zealand (RBNZ) was also first to hit the “pause” button with our last interest rate rise coming in May 2023. Over recent months, successive Official Cash Rate (OCR) announcements on 12 July, 16 August and 4 October, all maintained interest rates at the prevailing level of 5.50%.
In their October release, the RBNZ noted that although employment is still above its maximum sustainable level (one of the factors driving domestic or non-tradables inflation), recent indicators showed that employment intentions are flat and the difficulty in finding labour within the economy has reduced. Although the range of factors impacting inflation are many and varied, the RBNZ still anticipate inflation declining to within its 1% to 3% target range by the second half of 2024.
Similar to overseas trends, New Zealand government bond yields also rose during the quarter, with the New Zealand 10 year bond yield increasing from 4.65% to 5.34% by 30 September. With the June quarter gross domestic product figures confirming that New Zealand had exited its technical recession, as expected, New Zealand corporate bonds outperformed government bonds over the period.
The S&P/NZX A-Grade Corporate Bond Index fell -0.5% for the quarter, while the longer duration but higher quality S&P/NZX NZ Government Bond Index fell -2.8%.
Source: S&P/NZX A-Grade Corporate Bond Index
New Zealand Property
The NZ REIT sector was down -5.7% in the quarter and -4.5% over the year to end of September. Goodman Property reported that its valuations will be down approximately 4.7% with assessed market rental up 3.3%. Kiwi Property saw a decline of 5.8% of valuations of office assets although mixed-use asset changes were smaller.
The net yield on the sector is lower than government bond yields indicating lower risk-reward characteristics for the sector.
In the quarter, Precinct Property was the worst performer down -9.6%, followed by Vital Healthcare at -8.4% and Stride Property Group at -8.0%. Argosy was the only positive performer over the quarter up 2.0%.
Source: S&P/NZX All Real Estate Index.
Australian Shares
The Australian share market (S&P/ASX 200 Total Return Index) registered a small loss in the third quarter, falling -0.8% in Australian dollar terms.
Although numerous micro-cap basic materials firms and technology companies posted stellar gains, these had a negligible impact on the performance of the overall market.
In line with trends overseas, it was the energy sector which profited the most on the back of a strengthening oil price. Large capitalisation firms like Woodside Energy (+9.6%), Santos Ltd (+6.8%) and Origin Energy Ltd (+6.8%), along with a host of strong returns from much smaller energy firms, saw the energy sector overall deliver an average +11.2% for the quarter. With mega-cap basic materials firms BHP and Rio Tinto also both eking out small gains of +1.1% and +1.3% respectively, this helped the wider Australian share market navigate a difficult quarter with minimal downside.
In contrast, healthcare, consumer staples and information technology sectors all struggled and helped tip the overall index into the negatives. Notable underperformers included software infrastructure firm Block Inc (-28.7%) which suffered from weaker investor sentiment, and medical equipment company ResMed Inc (-27.8%) as their annual earnings fell short of analyst expectations.
While the local Australian index only recorded a small loss, the slightly weaker Australian dollar versus the New Zealand dollar over the quarter meant that reported returns to unhedged New Zealand investors reduced further to -1.9%.
Source: S&P/ASX 200 Index (total return)
Emerging Markets
Despite a strong start, the emerging markets recorded a negative return over the third quarter, declining by -2.8% in US dollar terms.
The Chinese share market experienced a sharp decline in August, with the country’s property sector faring particularly badly as investors doubted Beijing will deliver enough stimulus to get the world’s second largest economy back on track.
In Poland, political uncertainty ahead of October’s parliamentary elections prompted an unexpected interest rate cut that was poorly received. This contributed to Poland posting the largest decline amongst the index markets. Taiwan and Korea were also notably weak in a quarter where technology companies generally struggled.
Hungary and the Czech Republic both gained and outperformed the index, while the best returns came from Egypt and Turkey. In Turkey, two interest rate rises in the quarter were viewed as a sign the central bank may be becoming more orthodox in its policy approach, which was well received by Zealand the market.
While it was a negative quarter for the underlying emerging markets group, the slightly weaker New dollar helped contribute to a near-flat return to unhedged investors. The MSCI Emerging Markets Index produced a quarterly return of -0.5% in unhedged New Zealand dollar terms.
Source: MSCI Emerging Markets Index (gross div.)
International Shares
US and Eurozone share markets stumbled in the third quarter as interest rate concerns contributed to a weakening of investor sentiment. In the US, the concern was that interest rates would stay elevated for longer than initially expected, while in the Eurozone it was a concern about the impact recent rate hikes might have on economic growth.
Energy companies provided one of the few bright spots in the quarter. The information technology sector was one of the weakest over the quarter, with higher interest rates generally being negative for the valuation of many of these companies.
The UK share market rose over the quarter. The large, diversified energy and basic materials groups outperformed as they rebounded from weakness in the prior three-month period. A weaker British pound (versus the US dollar) provided support, and a sharp recovery in crude oil prices buoyed the energy groups.
Against most major currencies, the New Zealand dollar was a little weaker through the quarter which meant increased reported returns for investors holding unhedged foreign assets.
The MSCI World ex-Australia Index returned -2.5% for the quarter hedged to the New Zealand dollar and -1.2% for the unhedged index.
Source: MSCI World ex-Australia Index (net div.)
International Fixed Interest
In spite of a significant rise in oil prices, signs of easing core inflation measures across most economies allowed many major central banks to indicate a pause in further interest rate hikes.
Both the US Federal Reserve and the European Central Bank (ECB) raised interest rates in July by 0.25%, with the latter continuing to hike again in September. The ECB suggested that this might now be sufficient to guide inflation back to its target. The Bank of England raised their base rate to 5.25% in August.
However, despite the Federal Reserve and the Bank of England both keeping their benchmark interest rates steady in September, the markets began to anticipate a longer period of elevated interest rates. This was the key driver of increasing bond yields (meaning lower bond prices) over the period.
Over the quarter, the US 10 year bond yield trended steadily higher from 3.84% to 4.58%, with the two year bond yield moving from 4.90% to 5.05%, lessening the degree of inversion in the US yield curve. Germany’s 10 year bond yield also rose from 2.39% to 2.84%, while the UK 10 year yield adjusted only slightly from 4.39% to 4.50% with the market heartened by signs of slowing inflation.
The FTSE World Government Bond Index 1-5 Years (hedged to NZD) returned +0.6% for the quarter, while the broader Bloomberg Global Aggregate Bond Index (hedged to NZD) declined -1.8% due largely to longer average term of this index.
Source: FTSE World Government Bond Index 1-5 Years (hedged to NZD
International Property
Global REITs were down 4% over the quarter, and along with New Zealand property, are the two benchmarks in negative territory over one year.
Amongst the largest country exposures, quarterly returns were -7% for U.S. REITs, -5.9% for Australia REITs and -2.2% for Japan REITs.
For the largest sector exposures, quarterly returns were -5.4% for Industrial REITs, -7.9% for Retail REITs and -9.1% for Residential.
International Infrastructure
The FTSE Developed Core Infrastructure Index returned -5.6% in AUD terms over the quarter with a decline of -4.9% in September alone.
The largest asset allocations within the index at the end of December were Conventional Electricity at 34.9%, Railroads at 20.5%, Pipelines at 14.9% and multi-utilities at 11.8% of the index. The largest investments in the fund are NextEra Energy and Union Pacific Corp.
Source: S&P Developed REIT Index, FTSE Developed Core Infrastructure Index in AUD
Asset Class Returns To 30 September 2023
| Asset Class | Index Name | 3 mths | 1 year | 3 years | 5 years | 10 years |
|---|---|---|---|---|---|---|
| New Zealand shares | S&P/NZX 50 Index, (gross with imputation credits) | -4.8% | 3.0% | -0.5% | 4.7% | 10.2% |
| New Zealand property | S&P/NZX All Real Estate Index (Gross) | -5.7% | -4.5% | -4.9% | +2.1% | +6.9% |
| Australian shares | S&P/ASX 200 Index (total return) | -1.9% | 6.5% | 10.7% | 6.3% | 6.9% |
| International shares | MSCI World ex Australia Index (net div., hedged to NZD) | -2.5% | 20.6% | 8.7% | 7.0% | 10.0% |
| MSCI World ex Australia Index (net div.) | -1.2% | 14.0% | 11.7% | 9.5% | 12.0% | |
| Emerging markets shares | MSCI Emerging Markets Index (gross div.) | -0.5% | 4.7% | 2.0% | 3.0% | 5.8% |
| International property | S&P Global REIT Index (Gross div.) | -4.0% | -3.6% | +6.7% | +3.1% | +7.7% |
| New Zealand fixed interest | S&P/NZX A-Grade Corporate Bond Index | -0.5% | 2.5% | -2.8% | 0.8% | 3.1% |
| International fixed interest | FTSE World Government Bond Index 1-5 years (hedged to NZD) | 0.6% | 2.4% | -1.1% | 0.8% | 2.0% |
| International fixed interest | Bloomberg Global Aggregate Bond Index (hedged to NZD) | -1.8% | 1.7% | -3.9% | 0.2% | 2.7% |
| New Zealand cash | New Zealand One-Month Bank Bill Yields Index | 1.4% | 5.1% | 2.4% | 1.9% | 2.2% |


