


Oct-Dec 2023
Investment Market Review
It was most appropriate that the fourth quarter of 2023 included Christmas, as it was indeed a quarter of many happy returns.
Global share markets delivered strong gains as market expectations about the future trajectory of interest rates changed markedly over the quarter. While the consensus view in the September quarter was for interest rates to remain ‘higher for longer’, the focus over the last three months was on the potential for the US Federal Reserve to successfully engineer a ‘soft-landing’ for the US economy (i.e. inflation coming back under control without unduly impacting the wider economy). Increased hopes for this goldilocks scenario, which is vastly more preferable than the economy slumping into recession, saw share prices surge.
Global bonds also joined the party. The idea that US interest rates could begin falling in 2024 led to a reduction in long term bond yields, which sent bond prices up sharply. For investors who had endured a difficult period in bond markets over the last two years, this represented a welcome holiday gift.
A noteworthy aspect in all of this is that, for the most part, not much had really changed. Yes, oil and gas prices did decline (which was a positive), but global interest rate policy settings were largely unchanged, conflict in Ukraine and the Middle East continued, and businesses generally did not report dramatically improved profits or projections. The main ingredient that changed was investor expectations.
In September, when markets were anticipating interest rates being higher for longer, this impacted a number of important calculations, notably what the current price of bonds or shares should be. However, in a scenario where interest rates were now anticipated to be lower than previously expected, investors simultaneously reassessed asset valuations. What they had considered to be ‘fair’ prices in September were, within a matter of only a few weeks, considered to be ‘cheap’. And, like any rational consumer wanting to buy if they think they’re getting a bargain, investors did just that, pushing the prices of shares and bonds higher over the last three months of 2023.
When it comes to expectations changing, this can of course be a two-way street. Sometimes markets can overestimate potential future outcomes and when more up-to-date information becomes available, it can lead to a reduction in expectations. In those cases, prices will invariably go down. In the fourth quarter, however, that wasn’t the case, and positively changing expectations provided markets with a tailwind.
Inflation
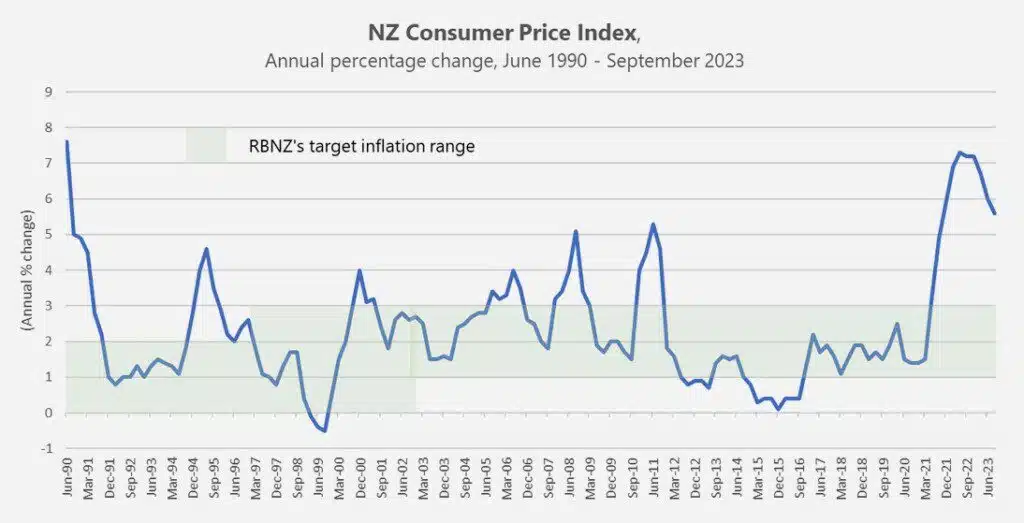
While investors have a natural interest in asset prices, central bankers are more focused on the prices of goods and services throughout the economy. In New Zealand’s case the Reserve Bank of New Zealand (RBNZ) aims to keep inflation (measured by the Consumer Price Index) between 1% and 3% over the medium term.
As the chart below shows, up until the emergence of Covid-19, the RBNZ had generally been quite successful in achieving this.
Unfortunately, the significant support payments made to businesses and workers to keep them solvent while Covid lockdowns were in place, eventually led to a
spike in inflation in 2021/22. Once we all got out of lockdown, the world’s factories (and broken supply chains) needed many more months to get operating again, and it quickly became clear that global production couldn’t match the surging demand from cashed-up consumers. For a period of time, we literally had a situation where far too much money was chasing too few goods – classic inflationary conditions.
This phenomenon was experienced all over the world, but in New Zealand’s case we have been slower to see inflation come back down again. The last official reading (for the 12 months ended September 2023) had domestic inflation at 5.6% – moving in the right direction from the high of 7.3% in mid 2022, but still well outside the RBNZ’s 1% – 3% target band.
Inflation in the US is only 3.1%, while ours is nearly double that, and the RBNZ will be reluctant to risk cutting interest rates too early for fear of reigniting another round of inflationary pressure here.
Migration
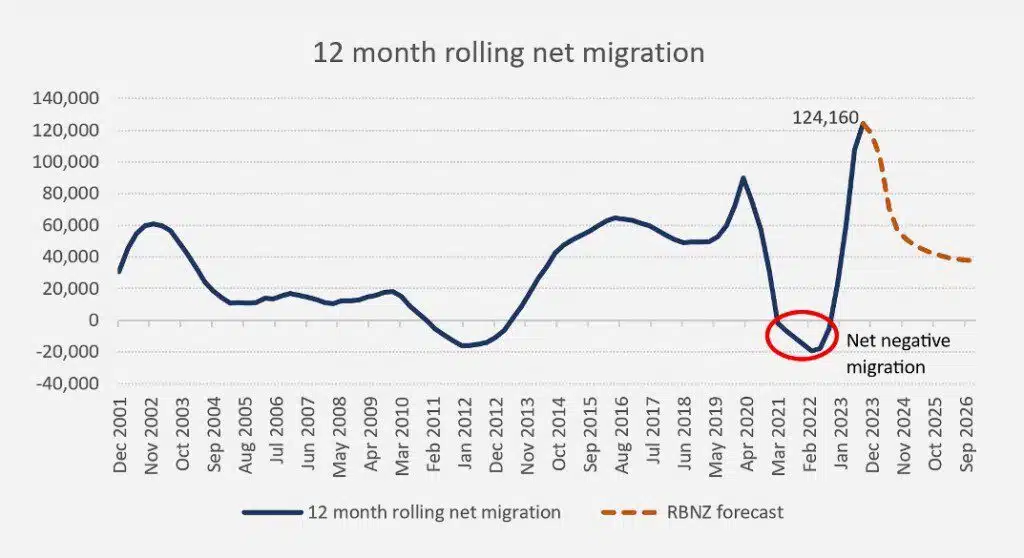
For the roughly two years when New Zealand’s borders were closed, we experienced net negative migration. However, once borders were eventually re-opened, net migration skyrocketed. In the 12 months to September 2023, we have welcomed over 124,000 more people to New Zealand to live, over and above the number that have chosen to leave. As the chart below shows, that represents easily the largest annual increase in net migration this century.
As everyone that comes to New Zealand needs somewhere to live and will generally either buy or rent some accommodation, it’s no wonder that unexpectedly high migration is now a significant factor in the RBNZ’s sensitivity to high inflation. After all, housing costs make up almost 30% of the Consumer Price Index and almost half of New Zealand’s non-tradable inflation.
From this current peak, the RBNZ are forecasting net migration to slow down quite quickly to a level of around 40,000 per annum by 2026. However, if this doesn’t happen – if net migration stays higher for longer – then this is likely to put further pressure on rents and house prices and, unfortunately, inflation.
In that event, for the RBNZ to continue to make progress towards meeting its medium-term inflation target, they will either need to see greater disinflationary forces coming from other parts of the economy and/or consider a tighter monetary policy stance than they might otherwise prefer (i.e. higher interest rates).
The Magnificent 7
While the main US share index (the S&P 500 Total Return Index) was up 26.3% in 2023, it was the so called Magnificent 7 (comprising Meta, Amazon, Apple, Alphabet, Microsoft, Nvidia and Tesla) that was responsible for the majority of the returns.
The price performance of these companies has, without doubt, been heavily influenced by investors’ growing fascination with the Artificial Intelligence (AI) story. However, history provides cautionary warnings about sky-high valuations driven by appealing stories.
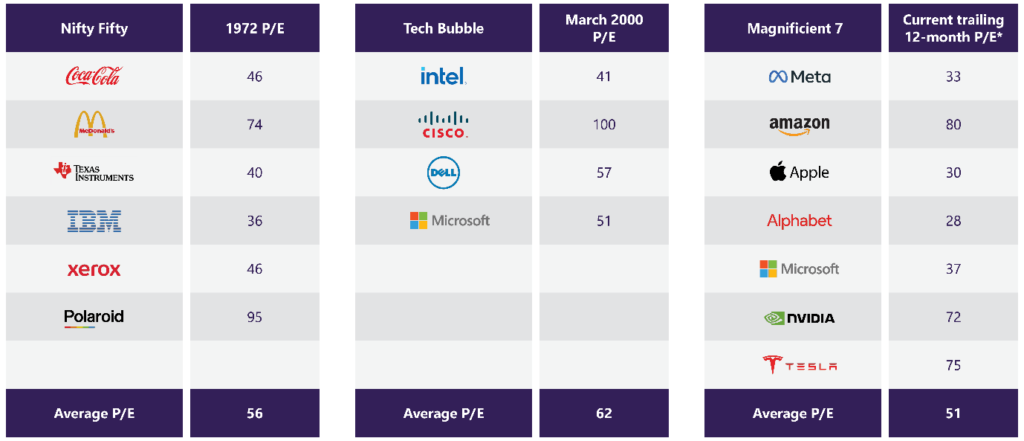
As the table below demonstrates, with an average price-to-earnings (P/E) ratio of around 51, the valuations of the Magnificent 7 are fast approaching the lofty levels briefly attained by the major Nifty Fifty stocks of the 1960s and 1970s and dotcom companies in the late 1990s, just prior to them eventually crashing. What these earlier periods were both remembered for was the tendency for many investors to ignore fundamental company valuation metrics, and instead make investment decisions based on popular sentiment.
While none of the above is intended to forecast a pending crash, it is a cautionary reminder that the Magnificent 7 shares, which currently make up about 30% of the total market capitalisation of the S&P 500 index, are at high valuations.
Long term investors, those who are not over-allocating to just a handful of high-priced companies, the news is much better – the rest of the market has valuations that are much closer to, or below, their historical averages.
If we look at several market-wide funds supplied by the Vanguard Group, we can get a better understanding of this.
As at the end of November 2023 –
The Vanguard US Total Stock Market ETF had a trailing 12-month P/E ratio of 21.8 (about its average over the last 40 years). However, if we excluded the Magnificent 7 from this calculation it would lower that figure significantly.
The Vanguard Total International (i.e. non-US) ETF had a P/E of 11.0, well below its historical average of about 21.
The Vanguard Emerging Markets Stock Index ETF had a P/E of just 7.6.
Outside of the Magnificent 7 companies, broader share market valuations continue to look fair, or even attractive by historical standards.
A new year
In some ways, 2023 was a frustrating year. The ongoing media noise about ram raids, law and order, the cost-of-living crisis, doctor shortages, housing market weakness, migration issues, the election, and the conflicts in the middle east and Ukraine, drowned out just about everything else.
One of the things it certainly drowned out was that investment markets delivered some pretty nice returns. Australian, emerging market and international developed share markets delivered double-digit returns, and the bond markets that had been decidedly weak over the last two years bounced back with strong contributions.
Of course, it wasn’t without a fair amount of volatility and uncertainty along the way, but when it comes to long-term investing in risky assets, it rarely is. If 2024 could be a repeat of 2023 in the markets, but with a happier news flow, it will be a year to look forward to!
As we enter the new year, portfolios continue to be well diversified and, as always, are well-positioned to pick up returns wherever they may arise.
In the meantime, when markets are unpredictable (as they are) and forecasting the future is impossible (as it is), the best approach remains the one that strategic investors have been successfully applying for years.
That is, staying invested, staying well diversified, and staying patient.
Key Market Movements for the Quarter
International share markets rebounded with a strong rally over the final three months of the year.
US inflation and economic growth rates both slowed further over the quarter, and Federal Reserve Chairman, Jerome Powell, indicated they were aware of the risk of keeping interest rates at restrictive levels for too long. This reinforced market expectations for potential US interest rate cuts in 2024.
More tellingly, this perceived shift in monetary policy direction from a ‘higher-for-longer’ stance to one of prospective interest rate cuts, resulted in the best quarterly performance of longer-term global bonds in over two decades. It also supported an end of year rally in the US share market and renewed strength in share markets globally.
Sectors that are usually more sensitive to changes in interest rates, such as information technology, real estate and consumer discretionary companies generally led the way.
Although sharply lower prices for natural gas, crude oil, and gas oil contributed to lower inflationary pressures over the quarter, it also resulted in energy companies generally struggling to perform in an otherwise very positive market environment.
+4.3%
The New Zealand share market, as measured by the S&P/NZX 50 Index, recovered most of last quarter’s weakness by delivering a +4.3% return from October to December. While several small companies outside the top 50 performed very strongly, more ‘index-relevant’ companies, on average, produced solid, if less spectacular, returns.
From within the top 50, Westpac, Auckland International Airport (AIA) and Fisher & Paykel Healthcare (F&P) led the way with quarterly returns ranging from 10.2% to 12.0%. Increased passenger numbers and a return to dividends provided a boost for AIA, while Westpac and F&P both announced improving profits.
While the news was positive for AIA it wasn’t mirrored by our flag carrier Air New Zealand which has seen its share price tending downwards since September as the company has grappled with supply constraints and capacity pressures. Air New Zealand shares declined by -13.0% over the quarter.
Ryman Healthcare was another notable firm to experience weakness in the fourth quarter. Ryman’s shares fell -6.5% following further write downs in the value of their investment properties, however the share price did stage a partial recovery in the last two weeks of December, as changing expectations about interest rates began to be seen as a positive for companies with exposure to property assets.
This fourth quarter gain of +4.3% helped the S&P/NZX 50 Index (gross with imputation credits) edge out of the negative and post a small gain of +3.5% for the calendar year..
Source: S&P/NZX 50 Index (gross with imputation credits)
+5.0%
New Zealand Fixed Interest
The Reserve Bank of New Zealand (RBNZ) surprised many with a ‘hawkish hold’ at its November Monetary Policy Statement meeting. In other words, while they did not announce an actual increase in interest rates, they signalled they were ready to increase them if inflation re-emerged.
What they did do was lift their Official Cash Rate (OCR) path to imply an 80% chance of a 0.25% interest rate hike next year. They also eliminated their prior forecast recession for the second half of 2023, reduced their unemployment rate forecast, and added to expectations of further house price gains. This is all despite almost all the economic data in recent months suggesting that monetary policy is working.
What appears to have changed at the RBNZ is –
- they are more concerned about high rates of net migration being inflationary (despite most evidence so far suggesting the opposite).
- their tolerance for inflation persisting above the 1% to 3% band has reduced.
- they are not happy with the market’s anticipation of interest rate cuts next year and are looking to ward off any overconfidence that future interest rate cuts are fait accompli.
In spite of this, the longer-term New Zealand government bond yields followed the international equivalents and fell significantly during the quarter, with the New Zealand 10 year bond yield declining from 5.34% to 4.39%.
The S&P/NZX A-Grade Corporate Bond Index gained +5.0% for the quarter, while the longer duration but higher quality S&P/NZX NZ Government Bond Index gained +7.3%. These strong results helped both indices post very respectable full year returns of +7.4% and +5.4% respectively in 2023.
Source: S&P/NZX A-Grade Corporate Bond Index
+6.5%
New Zealand Property
The NZ REIT sector was up 6.5% in the quarter and 5.5% over the year to end of December.
With gearing in the sector usually between 30-40%, the prospect of lower interest rates helped valuations and also lower yield available from the fixed income market.
In the quarter, Stride Property was the best performer at 15%. Precinct Property also had a good quarter, after a poor September quarter, and was up 11.5%. The worst performer was Argosy Property which was up 1.5%.
Source: S&P/NZX All Real Estate Index.
+8.9%
Australian Shares
The Australian share market (S&P/ASX 200 Total Return Index) registered a strong gain in the fourth quarter, rising +8.4% in Australian dollar terms.
While returns were generally quite evenly distributed across firms of different sizes, the notable exception was within the top 100 companies, where the largest 50 firms comfortably outperformed the next 50 firms. This was due in no small part to the five largest companies within the index – BHP, Rio Tinto, Commonwealth Bank of Australia, CSL Ltd and National Australia Bank – delivering quarterly returns of +13.9%, +19.5%, +11.8%, +14.3% and +8.5% respectively.
The reasons for these gains varied – BHP and Rio Tinto both benefited from a strong run up in iron ore prices over the quarter; bank lending margins generally improve when interest rates are rising (as they have been of late); and the share price of global biotechnology firm CSL ended on an upswing after a particularly volatile year.
In line with trends overseas, the energy sector was the clear laggard over the quarter given the backdrop of weaker international oil and gas prices. While a number of smaller Australian energy companies recorded good performances over the quarter, these performances were overshadowed by sector heavyweight Woodside Energy Group which delivered a -14.9% return.
While the return of the local Australian index was already impressive, the slightly stronger Australian dollar versus the New Zealand dollar over the quarter meant that reported returns to unhedged New Zealand investors increased a little further to +8.9%, taking the last 12 months return (also unhedged) to +13.0%.
Source: S&P/ASX 200 Index (total return)
+2.3%
Emerging Markets
Despite pressure early in the quarter, when rising bond yields and conflict in the Middle East weighed on emerging market returns, the quarter ended positively, although behind developed market shares.
Signs of a ‘soft landing’ for the US economy and increased expectations for interest rate cuts in 2024 were supportive. However, mixed economic data in China continued to suggest a lacklustre economic recovery from their Covid-induced slowdown. The ongoing Chinese real estate crisis also continued to weigh on sentiment. As the leading emerging markets constituent, the weak performance of China over the quarter acted as a drag on the broader emerging market performance.
Poland was the top individual performer over the quarter as markets welcomed Donald Tusk’s election as prime minister at the head of a pro-EU liberal coalition government, while Peru, Egypt and Mexico also posted strong double-digit returns. Brazil’s outperformance was driven by ongoing signs of slowing inflation and the Brazilian central bank’s resultant reduction in interest rates.
Taiwan was another notable performer, helped by strong returns from several technology-related stocks as the information technology sector globally outperformed.
While it was a solid quarter for the underlying emerging markets group, the stronger New Zealand dollar dampened some of those underlying gains. The MSCI Emerging Markets Index produced a quarterly return of +2.3% in unhedged New Zealand dollar terms, rounding out a +10.7% return for the full year.
Source: MSCI Emerging Markets Index (gross div.)
+9.4% (hedged to NZD)
+5.6% (unhedged)
International Shares
US and Eurozone share markets delivered strong gains in the final quarter of the year. Shares were supported by softer inflation figures in both regions, which raised hopes that interest rates may not only have peaked, but that rate cuts could become a reality sooner than previously expected.
Euro area annual inflation fell to 2.4% in November, when just a year previously it was recorded at 10.1%, while US consumer price inflation reduced to 3.1%. With economic growth also slowing in both regions, this data reinforced market expectations that the Federal Reserve (at least) has finished its rate hiking cycle and will move towards rate cuts in 2024.
Energy companies lagged the broader market as oil and gas prices moved sharply lower, while interest rate sensitive sectors such as information technology and real estate generally outperformed.
Responding to the same themes of slowing economic growth and moderating inflation, the UK share market also rose over the quarter, although not as impressively as the US or Eurozone markets.
Against most major currencies, the New Zealand dollar was a little stronger through the quarter which meant lower reported returns for investors holding unhedged foreign assets.
The MSCI World ex-Australia Index returned +9.4% for the quarter hedged to the New Zealand dollar and +5.6% for the unhedged index. This completed impressive full year returns for both indices of +23.2% and +24.5% respectively.
Source: MSCI World ex-Australia Index (net div.)
+3.0%
International Fixed Interest
After a tough couple of years, the final quarter of the year was a very positive one for fixed income markets, resulting in their best quarterly performance in over two decades, according to the Bloomberg Global Aggregate indices.
The major driver of this performance was the perceived shift in monetary policy direction, away from a ‘higher-for-longer’ stance towards prospective rate cuts in 2024. This resulted in Government bond yields falling sharply, and the bond prices rising.
The US Federal Reserve kept interest rates unchanged throughout the quarter, with a much clearer shift to a more ‘dovish’ tone in December which accelerated the market rally. The revised dot plot – a chart showing the Federal Open Market Committee projections for the future federal funds rate – indicated that three rate cuts are now anticipated for 2024, up from the previously expected two.
Other major central banks also held rates steady, although they appeared more cautious about inflation. The European Central Bank made progress in its plan to unwind some of its Pandemic Emergency Purchase Programme support, while highlighting concerns about domestic inflation. However, the market has priced in several Eurozone rate cuts for next year. Meanwhile, the Bank of England’s Monetary Policy Committee remained divided on further tightening.
As markets priced in easing conditions, government bond yields fell across the board. The US 10 year bond yield retreated from 4.58% to 3.87%, with the two year bond yield moving from 5.05% to 4.25%, slightly reducing the degree of inversion in the US yield curve. Germany’s 10 year bond yield also fell from 2.84% to 2.03%, while the UK 10 year yield moved from 4.50% to 3.54%.
The FTSE World Government Bond Index 1-5 Years (hedged to NZD) returned +3.0% for the quarter, while the broader Bloomberg Global Aggregate Bond Index (hedged to NZD) gained +5.7% due largely to the longer average duration of this index. Over the year, these indices returned +5.0% and +6.6% respectively.
Source: FTSE World Government Bond Index 1-5 Years (hedged to NZD)
9.8% (global property)
5.3% (global infrastructure)
International Property
Global REITs were up 9.8% over the quarter, and 12% for the year.
Amongst the largest country exposures, quarterly returns were 14.8% for U.S. REITs, 11.1% for APAC REITs.
International Infrastructure
The FTSE Developed Core Infrastructure Index returned 5.3% in AUD terms over the quarter.
The largest asset allocations within the index at the end of December were Conventional Electricity at 34.2%, Railroads at 20.2%, Pipelines at 14.9% and multi-utilities at 11.6% of the index. The largest investments in the fund are NextEra Energy and Union Pacific Corp.
Source: S&P Developed REIT Index, FTSE Developed Core Infrastructure Index in AUD
Asset Class Returns To 31 December 2023
| Asset Class | Index Name | 3 mths | 1 year | 3 years | 5 years | 10 years |
|---|---|---|---|---|---|---|
| New Zealand shares | S&P/NZX 50 Index, (gross with imputation credits) | 4.3% | 3.5% | -2.7% | 6.8% | 10.6% |
| New Zealand property | S&P/NZX All Real Estate Index (Gross) | 6.5% | 5.5% | -5.5% | 2.9% | 7.7% |
| Australian shares | S&P/ASX 200 Index (total return) | 8.9% | 13.0% | 9.5% | 10.9% | 7.9% |
| International shares | MSCI World ex Australia Index (net div., hedged to NZD) | 9.4% | 23.2% | 7.9% | 12.2% | 10.0% |
| MSCI World ex Australia Index (net div.) | 5.6% | 24.5% | 12.0% | 14.2% | 11.6% | |
| Emerging markets shares | MSCI Emerging Markets Index (gross div.) | 2.3% | 10.7% | -0.5% | 5.3% | 5.8% |
| International property | S&P Global REIT Index (Gross div.) | 9.8% | 12.0% | 8.7% | 6.5% | 8.7% |
| New Zealand fixed interest | S&P/NZX A-Grade Corporate Bond Index | 5.0% | 7.4% | -0.8% | 1.6% | 3.5% |
| International fixed interest | FTSE World Government Bond Index 1-5 years (hedged to NZD) | 3.0% | 5.0% | -0.2% | 1.1% | 2.3% |
| International fixed interest | Bloomberg Global Aggregate Bond Index (hedged to NZD) | 5.7% | 6.6% | -2.4% | 1.0% | 3.2% |
| New Zealand cash | New Zealand One-Month Bank Bill Yields Index | 1.4% | 5.5% | 2.8% | 2.1% | 2.3% |
Unless otherwise specified, all returns are expressed in NZD. We assume Australian shares and emerging market shares are invested on an unhedged basis, and therefore returns from these asset classes are susceptible to movement in the value of the NZD. Index returns are before all costs and tax. Returns are annualised for time periods greater than one year.