 0800 121 122
 Login
Login
Investment Market Review

The best time to have a fire drill is when the building’s not already burning.
The reason is simple, because any mistakes made during a drill are much less expensive than mistakes made during the real thing.
Why do we mention this?
Because if we can extend this analogy to investment markets, the markets were definitely not ‘burning’ in the second quarter of 2026. Far from it. Investors in fact have plenty of reasons to be very pleased about returns over the recent few months.
That’s what makes this a good time to have an impromptu fire drill for investors.
Of course, when the markets inevitably hit their next difficult patch, it won’t be a building you are looking to vacate, what you might be considering instead is exiting the markets themselves.
Don’t. For genuine long-term investors, the best thing you can do is… not panic. Also, never assume that scary headlines will always have a negative impact on investment markets.
They might, but news gets rapidly assimilated into securities prices and forward-looking markets can be surprisingly quick to move on.
We were reminded of that once again last quarter.
A stalemate in the Strait
The war in Iran departed from the script the US had initially imagined. It was not the quick 4-5 week conflict they expected when bombing began in late February. While the conventional military phase was largely completed within that timeframe, the broader conflict didn’t end. It morphed into a different type of war, where military strength mattered much less than time, politics, and local resistance.
In that phase, Iran’s remaining leverage wasn’t its army, it was geography – specifically its control over the Strait of Hormuz. By threatening any ships wanting to navigate this chokepoint for global oil supply, Iran was able to maintain significant supply uncertainty and send global energy prices sharply higher.
In that sense, after Iran’s military was largely defeated, the Strait itself became the primary economic battlefield. As long as safe passage through the Strait remained uncertain, the conflict couldn’t truly end from a market perspective. This development, largely unanticipated by the Trump administration when the war began, was the collateral damage that spilled over into the global economy.
Accelerating inflation
Prior to the conflict, the world economy was experiencing moderate economic expansion and improving sentiment. This was a welcome development given the trade uncertainty and tariff-related price pressures that had characterised much of 2025.
However, the Middle East conflict dimmed the lights on the burgeoning economic recovery through its impact on commodity markets and inflation expectations. With a new energy shock pushing inflation expectations back up, the domino-effect was an abrupt sentiment change across major central banks.
While many central banks had previously been signalling an intention to continue reducing interest rates to encourage growth, the conflict caused many of these rate plans to quickly be put on ice. In some cases, consideration was even given to increasing interest rates.
As investors priced in a higher likelihood that interest rates would remain elevated for longer, global bond yields rose and bond prices fell.
The paradox of share market returns
As the second quarter progressed, it became clear that the balance of global economic risks had changed.
The world was observing hostilities in the Middle East that showed no signs of resolving quickly and this was contributing to higher oil prices, and a deteriorating inflation outlook.
None of this would generally be considered ‘good news’ for share markets.
However, in the face of these headwinds, investors demonstrated resilience. Share markets, which are often more inclined to go down when global risks increase, decided to throw a party.
The US S&P 500 (total return index) went up by 15.2% during the quarter, Australasian share markets went up 5-6% and the MSCI Emerging Markets (gross index in USD) went up by a stunning 24.1%.
It’s returns like these that torpedo the idea that market forecasting is the pathway to investment outperformance. Even if someone could have accurately predicted the Iran war, oil price spike and rapidly changing inflation expectations, they – most likely – would have believed that selling out of shares would have been the best approach.
It’s not enough just to be right about the economic information that will arrive in the future. To be successful, you would also need to correctly predict how markets will react.
Why were these share markets so strong over the last three months?
The most likely reasons were a combination of:
- Still strong underlying corporate earnings (i.e. businesses remained profitable even though sentiment was weaker),
- Continued heavy global investment in technology, infrastructure and defence spending (generally considered to be supportive for share markets),
- Share markets are themselves ‘forward looking’. They focus less on the headlines of today, and far more on longer term market prospects (i.e. a return to pre-conflict oil prices and growth rates).
The New Zealand perspective
In the middle of the second quarter the Reserve Bank of New Zealand’s (RBNZ) monetary policy committee met for its scheduled 27 May review of the Official Cash Rate (OCR).
Immediately before the Iran war (on 28 February) interest rates in New Zealand were expected to be held at the existing level of 2.25% for some time, to assist with the fledgling economic recovery underway.
At the following meeting (8 April), just six weeks after hostilities commenced, the RBNZ decided to hold interest rates steady, but explicitly warned that rate rises could soon be required.
By the 27 May meeting, the decision had reduced to coin-toss. The RBNZ ultimately held rates steady again, albeit by a split vote of three to three. Interestingly, the three internal members of the committee all voted to keep the OCR unchanged, while the three external members favoured a 0.25% increase. Governor Anna Breman broke the deadlock with her casting vote ultimately delivering the ‘on-hold’ decision.
While there was disagreement amongst the committee on the appropriate timing of a hike, there was broad agreement that further interest hikes were now imminent, and the market moved to price an interest rate hike in July as a near certainty.
This eventuated immediately after the end of the quarter when, in their 8 July meeting, the RBNZ lifted the OCR by 0.25% to 2.50%.
In spite of a rapid decline in oil prices following the late June de-escalation of the Middle East conflict, the RBNZ observed that the effects of the earlier oil price rises would linger and that the outlook for medium-term inflation remained uncertain. They also stated that some “further reduction in monetary stimulus is likely to be required”, leading most local economists to project the OCR finishing 2026 somewhere between 2.75% and 3.00%.
Voting with their feet

Migration statistics are regularly reported in the media with the data often being used to comment on whether New Zealanders are generally happy to stay and live here or see greater opportunities overseas. The data is also relevant to certain sectors of the economy. For example, new migrants can bring much needed skills, and positive net migration can often result in increased demand for residential housing and higher house prices. However, like all statistics, migration data can easily be interpreted to suit a particular social or political narrative.
In recent times, media commentary has focused on “why are so many Kiwis leaving?” It seems a fair question when the statistics show that permanent emigrants (people leaving) increased from around 50,000 in March 2021 to over 110,000 in March 2026. That’s a sizable increase, but it’s also not the full picture.
New Zealand’s population has steadily grown over time, and it’s reasonable that the average number of people arriving and leaving in any year will naturally grow over time as well. It’s only when we look at the number of permanent emigrants as a percentage of the population that we can get a better perspective.
The annual percentage of the total population leaving New Zealand is highlighted by the solid black line in the chart below.
The blue dotted line shows annual average percentage of the population leaving. When calculating this average, we excluded the data from March 2020 and September 2021 (the period highlighted in the shaded circle). We have removed this period because this was when the world was first locked down, and subsequently recovering from, the Covid-19 pandemic. Emigration was artificially much lower then because of a combination of border closures and greater limitations on international travel.
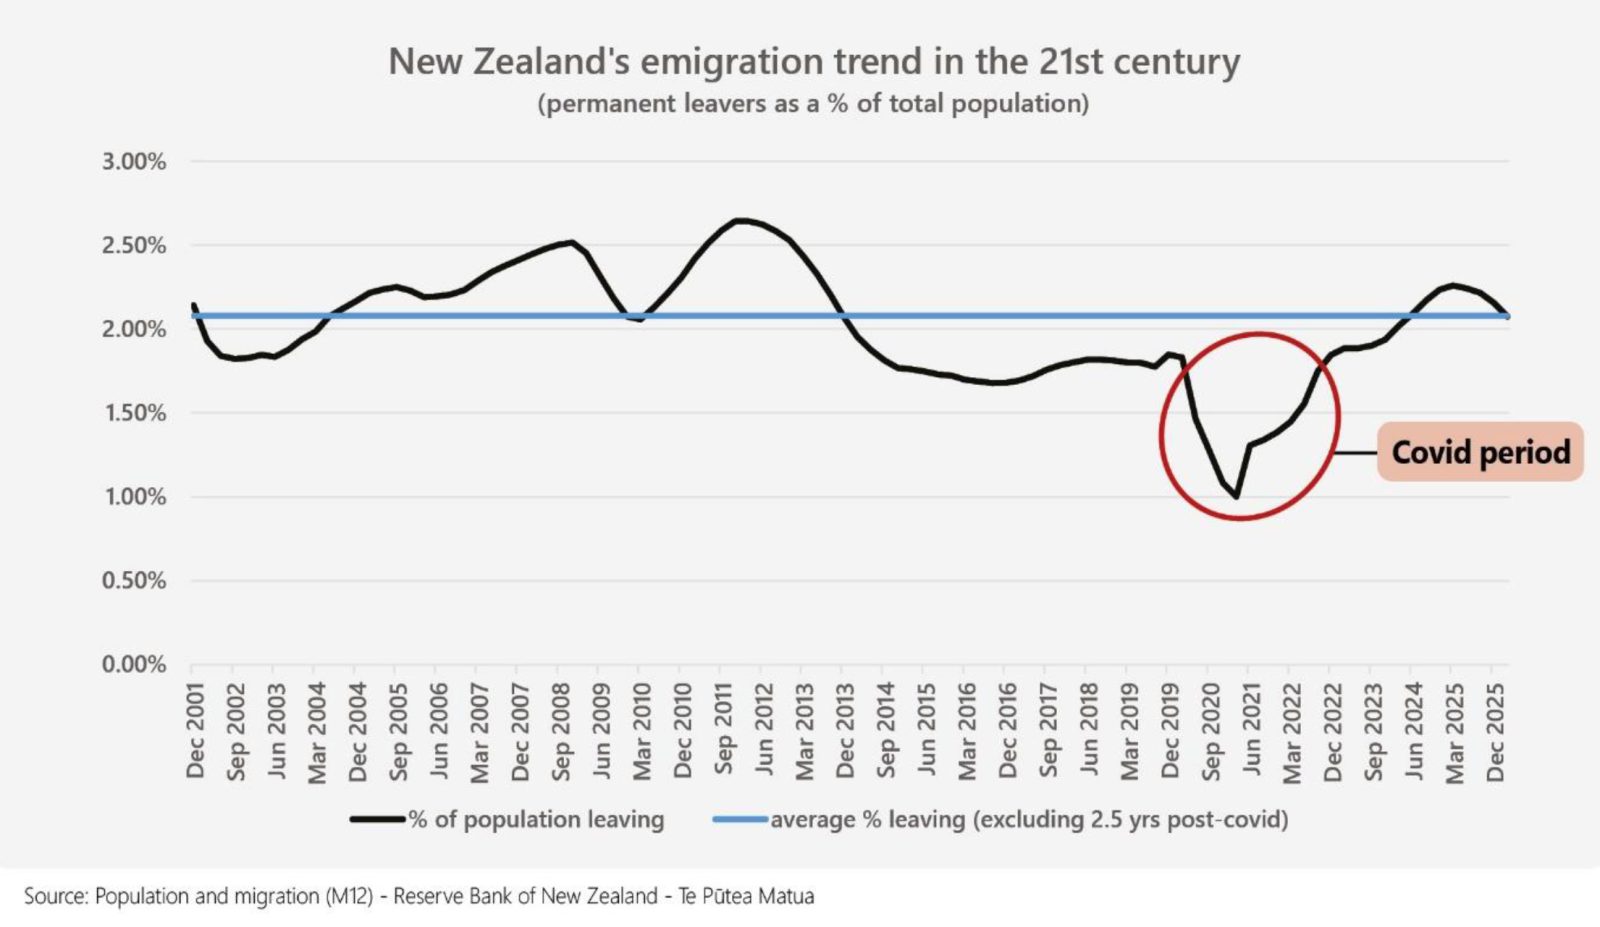
When emigration is assessed as a percentage of the underlying population, New Zealand’s data now looks entirely reasonable. Contrary to some of the recent headlines, New Zealanders aren’t suddenly leaving the country in droves. Over the 21st century so far, New Zealanders have permanently left our shores at an average rate (excluding covid) of 21 people per 1,000. The very latest government statistics to the end of March 2026, showed that over the prior 12 months the emigration rate was also 21 people per 1,000.
This means New Zealand’s current emigration rate is bang on its long run average. Completely, utterly, and boringly, normal.
It’s also worth noting that new migrants over the last 12 months outpaced emigrants by just over 24,000 so the New Zealand population continues to grow. Taken together, these trends confirm that New Zealand remains a highly desirable place to live, by global standards. Stable emigration and still positive net migration also underpins the future economic growth and prosperity of New Zealand Inc.
No secret recipe
Colonel Sanders may have a secret formula for fried chicken, but as we have stated many times in these market updates, there is no secret recipe when it comes to investing successfully.
Investing requires us to take risk. How much risk we take is a personal choice and is often a function of our individual risk tolerance and investment time horizon.
But one thing we have learned over many years is that risk never plays out as neatly as a projection graph in an investment plan might imply.
Sometimes, markets are benign, almost boring. Sometimes they are rising strongly and, every once in a while, they can fall uncomfortably quickly. It’s in those moments that we often learn the true meaning of risk tolerance.
It’s preparing for, and managing our response to those difficult times, that allows us to endure them. And if we can be resilient, or even brave, in the face of turbulent markets, the powerful advantage is that it allows us to be present and fully invested when the markets move our way.
Of all the potential ‘secrets’ to good investing, not allowing emotions to overrule a sound strategy is right up there with the best of them.
Although the second quarter of 2026 delivered great returns to most investors, this tells us almost nothing about what to expect next quarter.
Ultimately, one quarter’s results don’t matter too much when your investment journey is measured in a multiple of years. What matters is that you stay the course.
Remaining invested through good times and bad is how long-term investors get suitably rewarded for the risks they bear and the persistence they display during difficult times.
 Get In Touch